
Table of Contents
Payback Period Explained: Definition, Formula, and Calculation
- 5 min read
- Authored & Reviewed by: CLFI Team
Investment decisions rarely begin with complex valuation models. In practice, managers and boards often start with a simpler question that reflects operational reality rather than financial theory: how quickly will this investment return the cash we commit today. The payback period addresses this concern directly, which explains its continued presence in capital budgeting discussions despite its well-known limitations.
While modern finance education emphasises discounted cash flow techniques, the payback period remains embedded in internal approval processes across industries. Its persistence is not accidental. Liquidity constraints, uncertainty, and execution risk frequently dominate strategic thinking, particularly when firms operate in volatile markets or face competing capital demands.
Investment appraisal techniques such as the payback period, and their role within broader capital budgeting decisions, are examined in the Corporate Finance Executive Course.
Table of Contents
What Is the Payback Period
Definition:
Payback Period
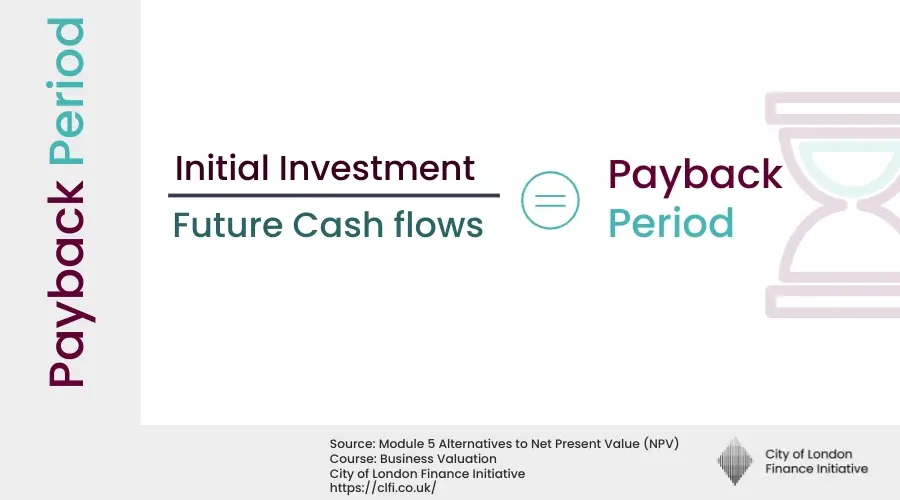
The period of time required for cumulative cash inflows from an investment to recover its initial cash outlay.
The payback period focuses exclusively on cash recovery rather than profitability or value creation. It measures how quickly an investment becomes self-financing, ignoring any cash flows that occur after the recovery point. As a result, it provides information about exposure duration rather than return magnitude.
This characteristic makes the metric intuitively appealing to non-financial decision-makers. Unlike net present value or internal rate of return, the payback period does not require assumptions about discount rates or terminal values. It translates investment risk into a time-based measure that aligns closely with operational planning horizons.
How the Payback Period Is Calculated
In its simplest form, the payback period is calculated by dividing the initial investment by the annual cash inflow, assuming those inflows are even. When cash flows vary over time, cumulative inflows are tracked year by year until the initial outlay is recovered.
The simplicity of this calculation is both its strength and its weakness. It allows rapid screening of projects but omits the timing of cash flows within the recovery window and assigns no value to returns beyond that point. This trade-off is central to understanding how payback should be used.
Why Firms Still Use Payback Analysis
Despite its limitations, empirical surveys consistently show that payback analysis remains widely used alongside discounted valuation methods. One reason is that it addresses concerns that discounted models often obscure, particularly liquidity pressure and execution risk in the early years of a project.
From a governance perspective, the payback period can also support capital discipline. By imposing maximum acceptable recovery horizons, boards create a safeguard against projects that lock up capital for extended periods without delivering early validation.
Limitations and Risks
The primary weakness of the payback period is that it ignores the time value of money. A project that recovers cash slowly but generates substantial long-term value may be rejected in favour of a faster-recovering but economically inferior alternative.
Additionally, payback analysis disregards cash flows beyond the recovery point, which can bias decisions against innovation, infrastructure investment, and strategic initiatives with long gestation periods. Used in isolation, it can therefore lead to systematic underinvestment.
Applied Example
Calculating the Payback Period
How long does it take for a project to recover its initial investment through annual cash inflows?
A business is evaluating a new project that requires an upfront investment of £100,000. The project is expected to generate consistent annual net cash inflows of £25,000. Management wants to know how many years it will take to recover the initial investment — this is the payback period.
The payback period measures liquidity and risk: the faster a project pays back its investment, the less time capital is tied up and exposed to uncertainty.
Identify the annual cash inflows
The project generates £25,000 of net cash inflow each year. This is the amount available to recover the initial investment.
Accumulate cash inflows year by year
| Year | Annual Cash Inflow | Cumulative Cash Inflow | Outstanding Balance |
|---|---|---|---|
| 0 | — | £0 | £100,000 |
| 1 | £25,000 | £25,000 | £75,000 |
| 2 | £25,000 | £50,000 | £50,000 |
| 3 | £25,000 | £75,000 | £25,000 |
| 4 | £25,000 | £100,000 | £0 |
By the end of Year 4, cumulative cash inflows equal the initial investment of £100,000. The outstanding balance reaches zero, meaning the project has fully paid back its cost.
Calculate the payback period
Interpret the result
The payback period is 4 years.
This means the business will recover its £100,000 investment after four years of operation. Projects with shorter payback periods are generally considered less risky, as they return capital more quickly. However, the payback period ignores cash flows beyond the payback point and does not account for the time value of money.
Learning takeaway
The payback period is a simple tool for assessing investment risk and liquidity. While it's useful for initial screening, it should be combined with other methods like Net Present Value (NPV) or Internal Rate of Return (IRR) for a complete financial evaluation.
Programme Content Overview
The Executive Certificate in Corporate Finance, Valuation & Governance delivers a full business-school-standard curriculum through flexible, self-paced modules. It covers five integrated courses — Corporate Finance, Business Valuation, Corporate Governance, Private Equity, and Mergers & Acquisitions — each contributing a defined share of the overall learning experience, combining academic depth with practical application.

Chart: Percentage weighting of each core course within the CLFI Executive Certificate curriculum.
Capital Is a Resource. Allocation Is a Strategy.
Learn more through the Executive Certificate in Corporate Finance, Valuation & Governance – a structured programme integrating governance, finance, valuation, and strategy.