

A founder raising a seed round needs to answer one question before the first investor call: what is the company worth today? How to value a startup is one of the most consequential questions in early-stage finance, because the answer determines how much equity changes hands, what share the founding team retains, and whether the terms leave room for future rounds without crushing early stakeholders. Startup valuation is the process of estimating that number, and it is fundamentally different from valuing an established business with years of audited accounts.
This guide explains six valuation methods used by investors and founders, shows how three of them produce different answers for the same company, and provides a decision framework for choosing the right approach at each stage.
Definition:
Startup Valuation
The estimated economic value of a startup's equity at a specific point in time, typically agreed between founders and investors during a financing round.
- What it means: The price tag placed on the company before (pre-money) or after (post-money) new capital enters.
- Why it matters: It determines how much ownership an investor receives in exchange for their capital.
- Used with: Cap tables, term sheets, convertible instruments, and exit modelling.
- Limitations: Unlike public companies with market-determined share prices, startup valuations are negotiated estimates based on projections, comparables, and judgement.
Table of Contents
- Pre-Money vs Post-Money Valuation
- Why Startup Valuation Is Different
- Comparable Company Analysis (Market Multiples)
- The Venture Capital Method
- The First Chicago Method
- Discounted Cash Flow (DCF) for Startups
- The Berkus Method
- The Scorecard Method
- The Cost-to-Duplicate Method
- Which Valuation Method Should You Use?
- How Dilution Changes Your Valuation
- Putting It Together: One Startup, Three Valuations
- Common Startup Valuation Mistakes
- What to Do With Your Valuation Number
Pre-Money vs Post-Money Valuation
Before applying any method, two terms must be clear. Pre-money valuation is the company's estimated value immediately before a new investment. Post-money valuation is the value immediately after the capital arrives. The relationship is straightforward: post-money equals pre-money plus the amount invested.
If a startup has a pre-money valuation of £8 million and raises £2 million, the post-money valuation is £10 million. The investor's £2 million buys 20% of the company (£2 million divided by £10 million). The founding team retains the remaining 80%.
A third concept, often overlooked, is carried interest in this context: the increase in value of the shares that existed before the round. If the founders originally invested £50,000 and the pre-money valuation is now £8 million, the value created for existing shareholders is £7.95 million. This figure acts as a reality check. When the pre-money feels unreasonably high or low relative to what the company has actually built, the underlying assumptions in the valuation method need revisiting.
Reasonable pre-money valuations vary by stage. A solo founder with a validated idea and no product might see a pre-money between £250,000 and £1 million. A technical team with patented technology, initial customers, and a growing market could justify £5 million to £10 million. These benchmarks are not formulas; they reflect how investors weigh the risk they are absorbing against the potential they are buying.
Why Startup Valuation Is Different
Established businesses can be valued from their financial statements: historical revenue, stable margins, and predictable cash flows provide the raw material for discounted cash flow (DCF) models and earnings multiples. Startups rarely have any of this. A two-year-old company with £500,000 in revenue and negative margins offers little for a traditional DCF to work with, yet it may be growing at 100% annually in a market that did not exist five years ago.
The challenge goes deeper than missing data. Venture capital funds operate under structural constraints that shape how valuations are set. A typical fund targets an Internal Rate of Return (IRR) between 30% and 60% per year and expects to exit each investment within three to five years. These requirements are not arbitrary preferences; they are commitments made to the fund's own investors, and they define what price a VC can afford to pay.
The compound effect of these return targets is often underestimated. The following table shows how many times each pound invested must multiply to meet the target IRR over different holding periods:
| Target IRR | 2 Years | 3 Years | 4 Years | 5 Years |
|---|---|---|---|---|
| 30% | 1.69x | 2.20x | 2.86x | 3.71x |
| 40% | 1.96x | 2.74x | 3.84x | 5.38x |
| 50% | 2.25x | 3.38x | 5.06x | 7.59x |
A fund targeting 40% IRR over three years needs every successful investment to return at least 2.74 times the capital deployed. Because many portfolio companies fail entirely, the survivors must return considerably more. This arithmetic drives every negotiation over valuation and equity percentage.
Comparable Company Analysis (Market Multiples)
The comparable company method estimates a startup's value by reference to how similar businesses are priced. The analyst identifies companies in the same sector and stage, selects a relevant metric (revenue, users, or gross profit), and applies the observed multiple.
If comparable software companies trade at 8 times annual recurring revenue and the startup generates £1.2 million in ARR, the implied valuation is £9.6 million. The method works best when genuine comparables exist: companies of similar size, in the same geography, with the same business model.
The limitations are significant for early-stage businesses. True comparables are rare, multiples fluctuate with market sentiment, and the method tells you what the market is paying today rather than what the company is intrinsically worth. For startups with revenue, enterprise value (EV) multiples such as EV/Revenue or EV/EBITDA provide useful reference points. The CLFI analysis of SaaS valuation metrics illustrates how these benchmarks vary by business model and growth profile.
In practice, comparables are most useful as a cross-check rather than a primary valuation method for startups. They answer the question "is our number in the right neighbourhood?" rather than "what is the company worth?"
The Venture Capital Method
The venture capital (VC) method works backwards from a projected exit value to determine what an investor should pay today. It is the most widely used approach in venture capital financing and can be broken into four steps.
Estimate the exit value. Project the company's revenue at exit using the expected growth rate, apply the anticipated profit margin, and multiply by a comparable valuation ratio.
Calculate the fraction required. Determine how much the investment must be worth at exit to meet the target IRR, then express that as a percentage of the exit value.
Derive the number of shares. Using the required fraction and the pre-existing share count, calculate how many new shares the investor must receive.
Calculate the maximum price per share. Divide the investment amount by the number of shares. This is the ceiling, not the offer; negotiation starts below it.
Worked Example: NovaBridge (Climate-Tech)
A VC fund considers investing £1.5 million in NovaBridge, a climate-tech software company. NovaBridge has £2 million in current revenue, growing at 45% annually. The fund expects to exit in four years. At exit, the company is projected to achieve a 25% after-tax profit margin, and comparable companies trade at 12 times earnings.
| Step | Calculation | Result |
|---|---|---|
| Projected revenue at exit | £2M x (1.45)^4 | £8.82M |
| After-tax profit at exit | £8.82M x 0.25 | £2.21M |
| Exit enterprise value | £2.21M x 12 | £26.46M |
| Required investment value at exit (40% IRR) | £1.5M x (1.40)^4 | £5.76M |
| Required fraction of the company | £5.76M / £26.46M | 21.77% |
NovaBridge was founded with 1,000,000 shares. The fund needs to own 21.77% at exit.
| Step | Calculation | Result |
|---|---|---|
| New shares for the fund | (0.2177 x 1,000,000) / (1 - 0.2177) | 278,362 shares |
| Maximum price per share | £1,500,000 / 278,362 | £5.39 per share |
The pre-money valuation implied by this price is £5.39 x 1,000,000 existing shares = £5.39 million. This figure also serves as a reality check. At roughly 2.7 times the company's current revenue, the multiple sits within a credible range for a high-growth climate-tech business, which increases confidence that the model's assumptions are reasonable. If the pre-money had come out at £25 million (12.5 times revenue for an early-stage company), the analyst would revisit the growth rate, margin assumptions, or exit multiple to identify where the model may be overstating the opportunity.
The critical insight is that the output of £5.39 per share is the maximum the fund can pay and still meet its return target. The fund would typically open negotiations below this figure, leaving a margin for execution risk. The four-step structure also makes the negotiation transparent: if the founder disagrees with the valuation, they can point to a specific assumption (the growth rate, the exit multiple, or the target IRR) rather than debating an abstract number.
The First Chicago Method
The First Chicago method extends the VC approach by running it across three scenarios and probability-weighting the results. Instead of a single projection, the investor models three outcomes:
Optimistic
The company hits or exceeds its growth targets and achieves a strong exit.
Survival
The company grows modestly, generating enough to return capital but not enough to deliver venture-scale returns.
Liquidation
The company fails and investors recover only a fraction of their capital, or nothing.
Using the NovaBridge example from above:
| Scenario | Exit Value | Probability | Weighted Value |
|---|---|---|---|
| Optimistic | £26.46M | 30% | £7.94M |
| Survival | £8.00M | 40% | £3.20M |
| Liquidation | £0.50M | 30% | £0.15M |
| Expected exit value | £11.29M |
With a probability-weighted exit value of £11.29 million (rather than £26.46 million in the pure VC method), the required fraction increases substantially, and the maximum price per share drops. This method is particularly useful when the range of outcomes is wide and the investor wants to price risk explicitly rather than hiding it inside a higher discount rate.
The scenario probabilities are judgement calls, not statistical calculations. An investor with deep sector experience might assign 40% to the optimistic case for a company with a signed enterprise customer, but only 15% for a company with no validated demand. The discipline of assigning explicit probabilities forces the investor to articulate their conviction level rather than hiding it inside a single, confident-looking forecast.
Almost no startup valuation guide covers the First Chicago method in depth, yet it reflects how experienced investors actually think: not in single forecasts, but in distributions of outcomes. For founders, understanding this approach provides insight into how VCs privately assess risk, even when they present a simpler framework at the negotiating table.
Discounted Cash Flow (DCF) for Startups
The discounted cash flow method estimates value by projecting future free cash flows and discounting them to the present using the weighted average cost of capital (WACC).
For startups, the standard DCF faces two problems. First, early-stage companies rarely generate positive free cash flow, so the near-term projections are negative or highly uncertain. Second, applying a single discount rate across both the volatile early years and the stable later years misrepresents the risk profile.
A practical adaptation splits the company's projected life into two stages. The growth stage (typically years one through five) uses a higher WACC to reflect elevated risk, uncertain revenue, and limited operating history. The maturity stage (year six onwards) uses a lower WACC consistent with an established business, and terminal value is calculated using a perpetuity growth model.
This two-stage approach is more honest than a single-rate DCF, but it demands many assumptions: growth rates, margins, capital expenditure, working capital, and two separate discount rates. Each assumption carries uncertainty, and the compounding effect means that small changes in inputs produce large changes in output.
The sensitivity of a startup DCF to its inputs can be illustrated simply. If a five-year revenue projection increases by 10%, the terminal value (which typically accounts for 70% or more of total DCF value) increases by a similar proportion, amplified by the perpetuity formula. A discount rate change from 25% to 30% can reduce the present value by 20% or more. When both inputs are uncertain, as they invariably are for early-stage companies, the output range becomes too wide to serve as a useful negotiation anchor.
In practice, most early-stage investors acknowledge that DCF requires too many assumptions to be reliable for pre-revenue or early-revenue startups. It becomes more useful at Series B and beyond, when the company has enough operating history to support credible projections. For earlier stages, the VC method or the qualitative approaches described below are more practical. For companies that do use DCF, the CLFI guide to debt vs equity financing provides additional context on how capital structure choices affect the discount rate and, by extension, the valuation output.
The Berkus Method
The Berkus method is designed specifically for pre-revenue startups. It assigns a monetary value to five risk-reduction milestones, each worth up to £500,000:
| Factor | What It Assesses | Maximum Value |
|---|---|---|
| Sound idea | Quality and size of the opportunity | £500,000 |
| Prototype | Reduction of technology risk | £500,000 |
| Quality management team | Reduction of execution risk | £500,000 |
| Strategic relationships | Reduction of market risk | £500,000 |
| Product rollout or sales | Reduction of production risk | £500,000 |
The maximum pre-revenue valuation under this framework is £2.5 million. Each factor is scored independently based on how far the startup has progressed in de-risking that dimension.
The method's strength is its simplicity and its focus on what matters at the earliest stage: has the founder built anything, assembled a capable team, and validated demand? Its weakness is the arbitrary cap and the absence of any connection to financial projections or market size. It works best for angel-stage investments where the purpose is to establish a reasonable starting point for negotiation, not to model future returns.
The Scorecard Method
The Scorecard method compares a startup against the median pre-money valuation for recently funded companies in the same region and sector, then adjusts that median based on weighted qualitative factors:
| Factor | Weight |
|---|---|
| Management team strength | 30% |
| Market opportunity size | 25% |
| Product or technology | 15% |
| Competitive environment | 10% |
| Marketing and sales channels | 10% |
| Need for additional funding | 5% |
| Other factors | 5% |
The analyst scores each factor relative to the median (above, at, or below average) and calculates a weighted adjustment. If the regional median for seed-stage fintech startups is £2 million and the weighted score produces a 1.15x multiplier, the implied valuation is £2.3 million.
Each factor is scored as a percentage of the median. A management team that is stronger than average might score 125% on the management factor. The weighted sum of all factors produces a composite multiplier that is applied to the regional median valuation.
The Scorecard method works well for pre-revenue companies with some traction (early customers, letters of intent, or a working prototype) and provides a more structured framework than the Berkus method. It also introduces a degree of market calibration that the Berkus method lacks, because the starting point is an observed median from actual deals rather than a theoretical cap. Its main limitation is the reliance on accurate regional benchmark data, which can be difficult to obtain outside major startup ecosystems such as London, Berlin, or the Bay Area.
The Cost-to-Duplicate Method
The cost-to-duplicate approach estimates the minimum value of a startup by calculating what it would cost to rebuild the business from scratch: development costs, prototype expenses, patent filings, physical assets, and the market value of hiring an equivalent team.
This method produces a floor, not a ceiling. It captures what has been built but ignores future potential, brand value, customer relationships, and market positioning. A startup that has spent £800,000 developing its product may have a cost-to-duplicate valuation of £800,000, even if its addressable market and growth trajectory suggest a value several times higher.
The method is most useful in two situations: when a startup has significant tangible or intellectual property assets, and when an investor needs a conservative baseline to anchor the lower end of a valuation range.
Which Valuation Method Should You Use?
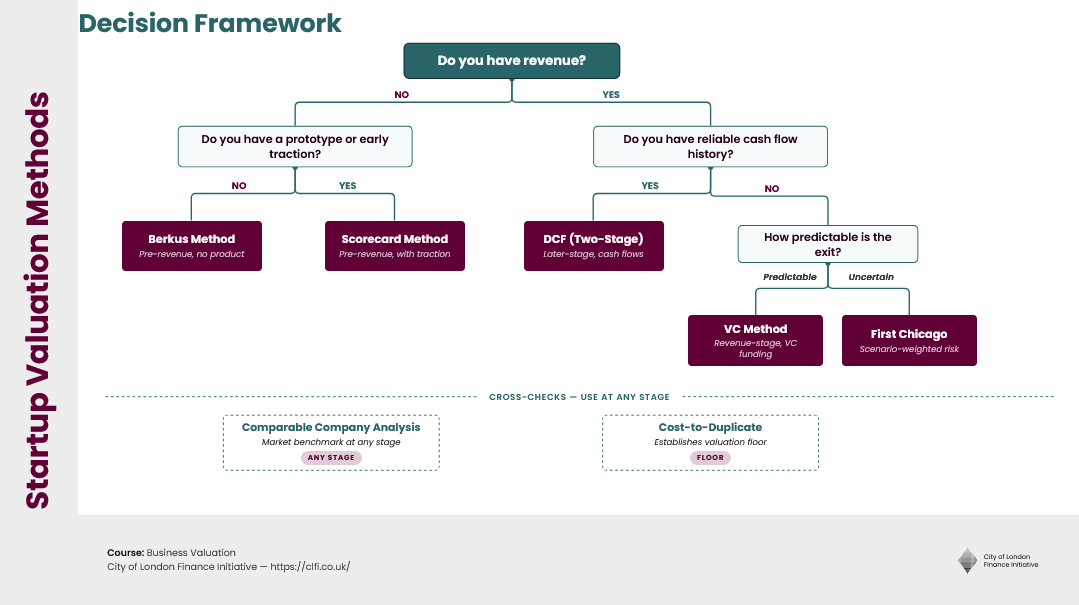
No single method fits every situation. The question of how to value a startup always comes back to three variables: the company's stage, the data available, and the purpose of the valuation.
| Situation | Recommended Method(s) | Why |
|---|---|---|
| Pre-revenue, no product | Berkus | Simplest framework for idea-stage |
| Pre-revenue, with prototype or early traction | Scorecard | Structured comparison against funded peers |
| Revenue-generating, seeking VC funding | VC Method | Directly models investor return requirements |
| Wide range of possible outcomes | First Chicago | Prices risk through scenario weighting |
| Later-stage with cash flow history | DCF (two-stage) | Projections are credible enough to discount |
| Quick market benchmark at any stage | Comparable Company | Cross-checks other methods against market pricing |
| Significant tangible or IP assets | Cost-to-Duplicate | Establishes a valuation floor |
For most fundraising conversations, the VC method provides the primary framework, with comparable company analysis as a cross-check. Pre-revenue companies should lead with Berkus or Scorecard and acknowledge the limitations of any single number.
How Dilution Changes Your Valuation
Startup financing rarely happens in a single round. Each subsequent round issues new shares, diluting the ownership percentage of everyone who came before. Understanding dilution is not optional; ignoring it leads to pricing errors that compound over time.
Venture capital investors prefer staged financing for two reasons. First, it limits the capital at risk during the highest-uncertainty period. Second, it creates milestone-based checkpoints that align the founder's incentives with the investor's return requirements. For founders, staged financing means giving up a smaller percentage at the riskier (cheaper) stage, with later rounds priced higher as the company de-risks.
The mathematical impact is measurable. Consider a company where a first-round investor needs to own 15% at exit to meet their return target. If a second round will issue additional shares, the first-round investor must acquire more than 15% in the initial round to ensure they still hold 15% after dilution.
Worked Example: TerraFlow (Seed Round Dilution)
TerraFlow raises £1.5 million in a seed round. The investor needs 15% at exit. The company has 1,000,000 existing shares. Without considering future dilution:
| Metric | Calculation | Result |
|---|---|---|
| Shares needed | (0.15 x 1,000,000) / (1 - 0.15) | 176,471 shares |
| Price per share | £1,500,000 / 176,471 | £8.50 |
Now assume a Series A of £3 million is expected in 18 months at twice the seed-round share price. The seed investor will not participate and will be diluted. With dilution adjustment:
| Metric | Calculation | Result |
|---|---|---|
| Series A shares issued | £3,000,000 / (£8.50 x 2) | 176,471 additional shares |
| Seed shares needed (adjusted) | Solve for 15% post-dilution | 198,529 shares (+12.5%) |
| Adjusted price per share | £1,500,000 / 198,529 | £7.55 (was £8.50) |
The difference between £8.50 and £7.55 per share reflects the cost of anticipated dilution. Founders who present a valuation without accounting for planned future rounds are, in effect, offering a price that will not deliver the investor's target return.
Over multiple rounds, founder dilution follows a consistent pattern. A founding team that starts at 100% might hold 70% after a seed round, 45% after Series A, 30% after Series B, and 20% or less by the time the company reaches an IPO or acquisition.
The trajectory illustrates a second, less obvious pattern: investor returns compress at later stages. Early investors who buy at low prices earn the highest multiples on their capital, sometimes 50x or more if the company succeeds. Later-stage investors pay higher prices and earn lower multiples, sometimes only 1.5 to 3 times their investment. This is not a flaw in the system; it reflects the risk-return relationship. Early-stage capital absorbs more risk (most startups fail) and is therefore priced to deliver higher returns when a company succeeds.
For founders, dilution is the cost of the capital that enabled growth. The relevant question is not "how much ownership did the founders lose?" but "is 20% of a £200 million company worth more than 100% of a £2 million company?" The answer, in virtually every successful venture outcome, is yes.
Putting It Together: One Startup, Three Valuations
Worked Example: MediLens (Health-Tech, Three Methods Compared)
MediLens is a health-tech startup that has built a diagnostic imaging platform. The company has £1.8 million in annual revenue, is growing at 50% per year, and is raising a £2 million seed round. The founding team holds 1,200,000 shares.
Method 1: Comparable Company Analysis
Health-tech software companies at a similar stage have recently been valued at 5 to 7 times revenue. Applying a 6x multiple to £1.8 million gives an implied valuation of £10.8 million.
Method 2: Venture Capital Method
The investor targets a 45% IRR with a four-year exit.
| Step | Calculation | Result |
|---|---|---|
| Projected revenue at exit | £1.8M x (1.50)^4 | £9.11M |
| Exit earnings (20% margin) | £9.11M x 0.20 | £1.82M |
| Exit value (14x PER) | £1.82M x 14 | £25.50M |
| Required value at exit (45% IRR) | £2M x (1.45)^4 | £8.84M |
| Required fraction | £8.84M / £25.50M | 34.67% |
| Pre-money valuation implied | £3.77M |
Method 3: First Chicago (Scenario-Weighted)
| Scenario | Exit Value | Probability | Weighted |
|---|---|---|---|
| Optimistic | £25.50M | 25% | £6.38M |
| Survival | £6.00M | 45% | £2.70M |
| Liquidation | £0.30M | 30% | £0.09M |
| Expected | £9.17M |
Required fraction against the expected exit: £8.84M / £9.17M = 96.4%. At this level, the deal does not work for either party; the investor would need nearly all of the company to meet their return target, leaving almost nothing for the founders.
Interpreting the Range
The three methods produce very different pictures:
| Method | Implied Pre-Money | Investor Gets |
|---|---|---|
| Comparables | £10.80M | 15.6% |
| VC Method (single scenario) | £3.77M | 34.7% |
| First Chicago (weighted) | Deal does not close | 96.4% |
The comparable analysis is optimistic because it reflects what the market is paying today without stress-testing whether those prices are supported by the company's fundamentals. The VC method assumes the optimistic scenario is the only scenario. The First Chicago method reveals that when downside risk is priced in, the deal economics change dramatically.
In practice, the investor and founder would negotiate within the range between the VC method output (£3.77M) and the comparable figure (£10.8M), with the First Chicago analysis informing how much risk premium is appropriate. If the founder can reduce perceived risk (through a signed enterprise customer, a regulatory approval, or a stronger management hire), the negotiated price moves toward the higher end of the range.
Common Startup Valuation Mistakes
Ignoring dilution from future rounds. The worked example above showed a 12.5% share-count difference between pricing with and without dilution. Presenting a valuation that does not account for planned future funding rounds understates the true cost to early investors.
Skipping the reality check. A pre-money valuation should be tested against common sense. If a pre-revenue company with two employees is valued at £15 million, the number may be mathematically correct within a model but economically implausible. Working backwards from the pre-money to a price-to-sales or price-to-user ratio provides a quick sanity test.
Anchoring to a single method. Each method captures a different dimension of value. Relying on one and ignoring the others creates blind spots. The MediLens example above demonstrates how a single-method view can be misleading in either direction.
Confusing valuation with price. A valuation model produces an estimate. The actual price is determined by negotiation, market conditions, deal terms, and the relative leverage of each party. A company valued at £8 million by three methods might raise at £6 million if the fundraising market is cold, or £12 million if two investors are competing for the deal.
Using vanity metrics as valuation inputs. App downloads, social media followers, and website traffic are activity indicators, not value drivers. Valuation methods require metrics with economic substance: revenue, margins, customer acquisition costs, retention rates, and addressable market size.
Over-engineering pre-revenue valuation. Applying a full DCF model to a company with no revenue and no operating history produces a false sense of precision. The output looks rigorous but rests entirely on assumptions about a future that may bear no resemblance to the forecast. For pre-revenue companies, Berkus or Scorecard methods acknowledge the uncertainty honestly rather than masking it behind a spreadsheet.
What to Do With Your Valuation Number
A valuation figure is the beginning of a conversation, not the end of one. The output of any method represents the maximum price an investor should pay to meet their return target, or the estimated worth based on market comparables. It is not a fact to be defended; it is a position to be negotiated.
When presenting to investors, frame the valuation as a range rather than a single number, and be prepared to explain which methods you used and what assumptions underlie each one. A founder who can articulate why the VC method produces £4 million and the comparable analysis suggests £10 million, and who can explain what would need to be true for each number to hold, demonstrates the financial literacy that investors look for.
In some cases, the best approach is to defer the valuation entirely. Instruments such as convertible notes and SAFEs (Simple Agreements for Future Equity) allow early-stage companies to raise capital without setting a price, converting the investment into equity at a future round when more information is available and a price can be set with greater confidence.
When the stakes are significant (a large round, a complex cap table, or a strategic investor), professional valuation advice is worth the cost. The frameworks in this guide provide the analytical foundation for that conversation.
In practice, startup valuation is where financial modelling meets judgement. The methods described here provide structure for that judgement, but the final number always reflects a negotiation between two parties who see different futures for the same company. The founders who navigate this process most effectively are those who understand the mechanics well enough to know where the models are strong, where they are fragile, and where the real conversation begins.
The principles behind venture capital valuation, exit modelling, and investment structuring are examined in depth in the Business Valuation Executive Course, which covers DCF, relative valuation, and deal pricing within a structured executive learning framework.
Programme Content Overview
The Executive Certificate in Corporate Finance, Valuation & Governance delivers a full business-school-standard curriculum through flexible, self-paced modules. It covers five integrated courses — Corporate Finance, Business Valuation, Corporate Governance, Private Equity, and Mergers & Acquisitions — each contributing a defined share of the overall learning experience, combining academic depth with practical application.

Chart: Percentage weighting of each core course within the CLFI Executive Certificate curriculum.