
Table of Contents
CAGR Formula & Calculator: Compound Annual Growth Rate Explained
- CLFI Team
- 4 min read
The Compound Annual Growth Rate, commonly known as CAGR, measures how fast an investment, company, or market metric has grown each year over a defined period, assuming a steady compounded rate. It provides a single, consistent figure for multi-year performance and reduces the distortion that arises from year-to-year volatility, which makes it useful for comparing growth across businesses, portfolios, or product lines over time.
Table of Contents
- Definition of CAGR
- How CAGR Is Calculated
- Understanding the Formula
- Practical Example
- Download: CAGR Calculator Template
- Interpretation and Uses
- What Is a Good CAGR?
- In Practice
- Further Reading
Definition of CAGR
Definition:
Compound Annual Growth Rate (CAGR)
CAGR is the constant annual rate that, when compounded once per year, would take a metric from its beginning value to its ending value over a stated number of years. It summarises multi-year growth into a single figure and assumes smooth compounding between the start and end points.
Annual growth rates often fluctuate due to macroeconomic conditions or operational changes. CAGR smooths these fluctuations into one compounded rate, providing a clearer view of longer-term progress. Executives and analysts use it for revenues, assets under management, market indices, user bases, or any metric observed at discrete points in time.
How CAGR Is Calculated
CAGR assumes compounding, that is, each year’s growth builds on the prior year’s level. Unlike a simple average of annual percentage changes, which ignores compounding and can mislead when growth varies, CAGR uses only three inputs: the beginning value, the ending value, and the number of years in the period.
Mathematically, CAGR is expressed as:
Compound Annual Growth Rate (CAGR) Formula
where n = number of years in the period.
The formula returns the single compounded rate that converts the beginning value into the ending value over n years. CAGR does not account for interim cash flows, irregular timing between observations, or reinvestment assumptions; it is an endpoint-to-endpoint growth measure.
Understanding the Formula
The question CAGR answers is practical: what steady annual rate would take the starting amount to the ending amount across the period measured. For example, if revenue grows from £50 million to £100 million in five years, the CAGR is the constant rate that results in this doubling. The measure abstracts from short-term swings and focuses on the compounding effect across the full horizon.
This smoothing is helpful for communication and comparison, though it comes with a trade-off. Because CAGR compresses a path into a single rate, it does not reveal volatility, drawdowns, or back-loaded recoveries. As a result, it should be complemented with the year-by-year series, dispersion statistics, or drawdown indicators when risk is under review.
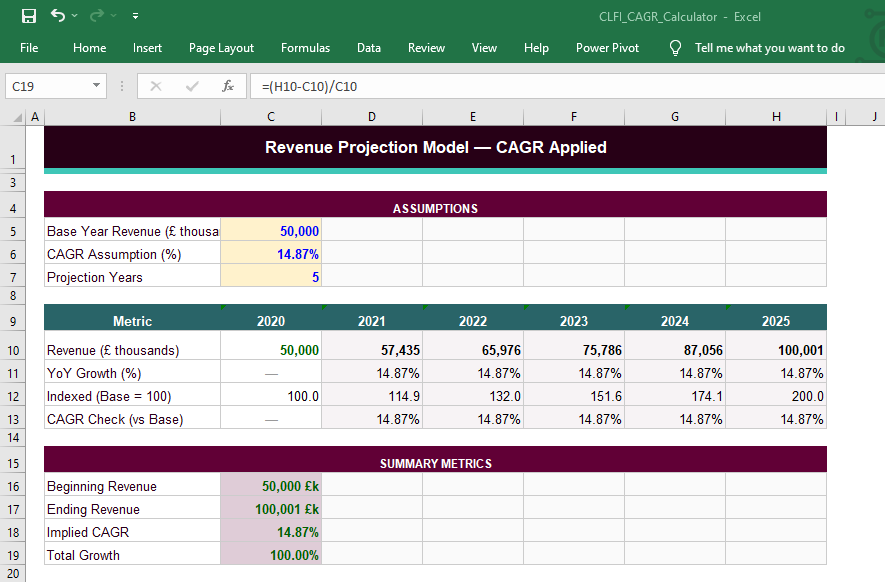
The CAGR calculator template below applies both methods covered in this section directly to a five-year revenue model, allowing you to change the inputs and observe how the growth rate responds in real time.
 Free Template
CLFI Insight — Practice Template
CAGR Calculator
Excel Template
A ready-to-use spreadsheet built to accompany this article. Apply both calculation methods to your own data and explore a five-year revenue projection model.
- Method 1 — Direct exponentiation formula with step-by-step breakdown
- Method 2 — RATE function with argument guide
- 5-year revenue projection model with CAGR assumption input
- Indexed growth series and YoY percentage calculations
- Compatible with Microsoft Excel and Google Sheets
For educational use only. This template does not constitute financial, investment, or professional advice. All outputs depend on user-supplied inputs. CLFI accepts no liability for decisions made in reliance on this material. Consult a qualified adviser for advice specific to your circumstances.
Worked Example: CAGR in Practice
Consider a UK manufacturing business whose revenue grew from £50 million to £100 million over five years. The year-by-year data, however, reveals a volatile journey with annual growth rates ranging from 6.9 per cent to 20.3 per cent, making any single year a misleading basis for assessing the business's overall performance.
WORKED EXAMPLE
Revenue Growth: £50m to £100m Over Five Years
UK manufacturing sector — illustrating how CAGR smooths a volatile year-by-year growth profile into a single comparable rate.
| Year | Revenue (£m) | Annual Growth |
|---|---|---|
| Year 0 | 50.0 | Baseline |
| Year 1 | 58.0 | +16.0% |
| Year 2 | 62.0 | +6.9% |
| Year 3 | 74.0 | +19.4% |
| Year 4 | 89.0 | +20.3% |
| Year 5 | 100.0 | +12.4% |
The table makes the volatility visible. What CAGR does is reduce this uneven sequence to a single annualised rate that describes the overall trajectory, stripping out the year-by-year noise to produce a figure that can be placed directly alongside any other business measured over the same period.
CALCULATION
CAGR = (100 / 50)(1/5) − 1 = 2.00.2 − 1 = 1.1487 − 1 = 14.87%
The result of 14.87 per cent holds its value in a benchmarking context because it was derived from the same endpoints and time horizon as any comparable metric. A competitor that grew revenue from £80 million to £180 million over the same five years produced a CAGR of 17.6 per cent, and that comparison is valid regardless of how different the two businesses' year-by-year growth patterns may have been. This is precisely the analytical value of CAGR: it reduces structurally different growth trajectories to a common, time-adjusted standard that allows fair comparison across businesses, sectors, and markets.
How to Calculate CAGR in Excel
The CAGR formula translates directly into Excel using the standard exponentiation operator, where the syntax mirrors the mathematical formula precisely. Two approaches are available, and understanding both gives more flexibility when working across different modelling environments.
General Syntax
=(Ending Value / Beginning Value)^(1/n) - 1
Revenue Example — Beginning Value in B2, Ending Value in B7
=(B7/B2)^(1/5)-1
Applying this to the five-year revenue example produces 14.87 per cent. The structure is identical to the mathematical formula, which makes it straightforward to audit and easy to adapt when the number of periods changes — updating the denominator from 5 to the relevant figure is all that is required.
General Syntax
=RATE(n, 0, -Beginning Value, Ending Value)
Revenue Example
=RATE(5, 0, -50, 100)
In this form, n is the number of periods, 0 indicates no intermediate payments, the beginning value is entered as a negative number reflecting the convention for an initial outlay, and the ending value is positive. For the revenue example, =RATE(5, 0, -50, 100) returns 14.87 per cent, confirming the same result as the direct method.
Both methods produce the same result, though the direct formula tends to be more transparent and easier to audit in a financial model. The RATE function comes into its own when working inside an existing cash flow template that already uses Excel's financial function library, since its structure aligns with the conventions already in place and reduces the risk of introducing inconsistent syntax across a larger model.
Programme Content Overview
The Executive Certificate in Corporate Finance, Valuation & Governance delivers a full business-school-standard curriculum through flexible, self-paced modules. It covers five integrated courses — Corporate Finance, Business Valuation, Corporate Governance, Private Equity, and Mergers & Acquisitions — each contributing a defined share of the overall learning experience, combining academic depth with practical application.

Chart: Percentage weighting of each core course within the CLFI Executive Certificate curriculum.
Capital Is a Resource. Allocation Is a Strategy.
Learn more through the Executive Certificate in Corporate Finance, Valuation & Governance – a structured programme integrating governance, finance, valuation, and strategy.
What Is a Good CAGR?
Whether a CAGR figure is strong, weak, or unremarkable depends entirely on context. The same 12 per cent annualised growth rate represents an exceptional outcome for a FTSE 100 manufacturer and a concerning slowdown for an early-stage technology business. Sector norms, company maturity, and market conditions all shape the relevant benchmark, which means evaluating any CAGR figure requires knowing what it is being measured against before drawing any conclusion.
BENCHMARK REFERENCE
Typical CAGR Ranges by Context
Reference benchmarks for revenue growth, investment return, and market expansion — what each range means in its own analytical context.
| Context | Typical CAGR | What It Represents |
|---|---|---|
| FTSE 100 — long-run total return | 7–9% | Market-rate compound return for large-cap UK equity — the baseline against which most investment strategies are measured |
| Mature industrial or consumer business | 5–10% | Stable organic revenue growth in established, lower-volatility sectors where market share is largely fixed |
| Healthcare and pharmaceutical | 10–15% | Organic revenue growth in regulated sectors with extended product development cycles and pricing protection |
| Post-acquisition revenue synergy | 3–7% | Growth rate built into deal models for a combined entity following integration — typically conservative to reflect execution risk |
| Private equity portfolio company | 20–25% | Revenue CAGR consistent with fund IRR targets above the typical 20% hurdle rate, before accounting for leverage effects |
| High-growth technology / SaaS | 30–50%+ | Venture-stage revenue expansion benchmarks — growth below 20% in this segment typically signals meaningful deceleration |
These ranges are reference points rather than fixed targets, and the distinction matters when evaluating a real business. A private equity portfolio company achieving 15 per cent revenue CAGR may still be delivering against plan if the equity return clears the fund's hurdle rate on an IRR basis. A listed industrial growing at 8 per cent may be outperforming its sector peers while trailing the broader index. In both cases the relevant question is whether the growth rate creates value given the cost of the capital deployed to generate it, and that threshold shifts with sector, leverage, and market conditions rather than holding at any single percentage.
Interpretation and Uses
CAGR is widely applied in finance and strategy. Investors compare portfolio or index growth over multi-year windows, analysts evaluate trends in revenue, EBITDA, or subscribers, and management teams present long-term progress across divisions and regions. The appeal is comparability: different year-on-year paths can be reduced to one rate for like-for-like assessment.
The limitation is that CAGR ignores volatility, timing, and cash flow patterns. Two assets with the same CAGR may have very different drawdowns or risk exposures. For decisions where timing and interim cash flows matter, methods that model cash flow timing and discounting, such as DCF or IRR, are more informative. In practice, teams often report both: CAGR for communication and a separate set of risk or cash flow metrics for decision quality.
In Practice
In practice, executives use CAGR to communicate long-horizon growth clearly to boards and investors, especially when comparing multiple units, geographies, or product lines. It supports strategic storytelling and external benchmarking, while risk oversight relies on the underlying series, scenario ranges, and drawdown or dispersion metrics. As a result, CAGR is most effective when paired with complementary measures that reveal the path taken to reach the end value.
Learn more in the Executive Certificate in Corporate Finance, Valuation & Governance.