

Cost of Goods Sold, usually shortened to COGS, measures the direct cost consumed in producing or acquiring the goods a business actually sells during a reporting period. It sits immediately below revenue on the income statement and determines gross profit, which makes it one of the clearest tests of whether a company’s core production or sourcing model leaves enough margin to support overhead, investment, and shareholder returns.
Definition
Cost of Goods Sold (COGS)
The direct cost recognised when goods are sold, typically including materials, direct labour, and attributable production overhead, while excluding selling, financing, and broader administrative costs.
What it means
COGS captures the direct cost attached to the goods sold in the period rather than the total cost incurred across the business.
Formula
COGS equals opening inventory plus purchases or production cost, less closing inventory, which applies the matching principle to the income statement.
Why it matters
Gross margin begins with COGS, so any change in input prices, efficiency, product mix, or inventory accounting flows straight into operating performance.
Common pitfall
COGS excludes SG&A, R&D, interest, and other non-production costs, so misclassification can distort gross margin even when EBIT is unchanged.
Key variable
FIFO, weighted average, and LIFO under US GAAP push different cost layers into COGS, which means peer analysis depends on aligned accounting policies.
Executive use
Finance teams use COGS to diagnose production economics, model cash generation, benchmark competitors, and challenge whether reported gross margins are genuinely comparable.
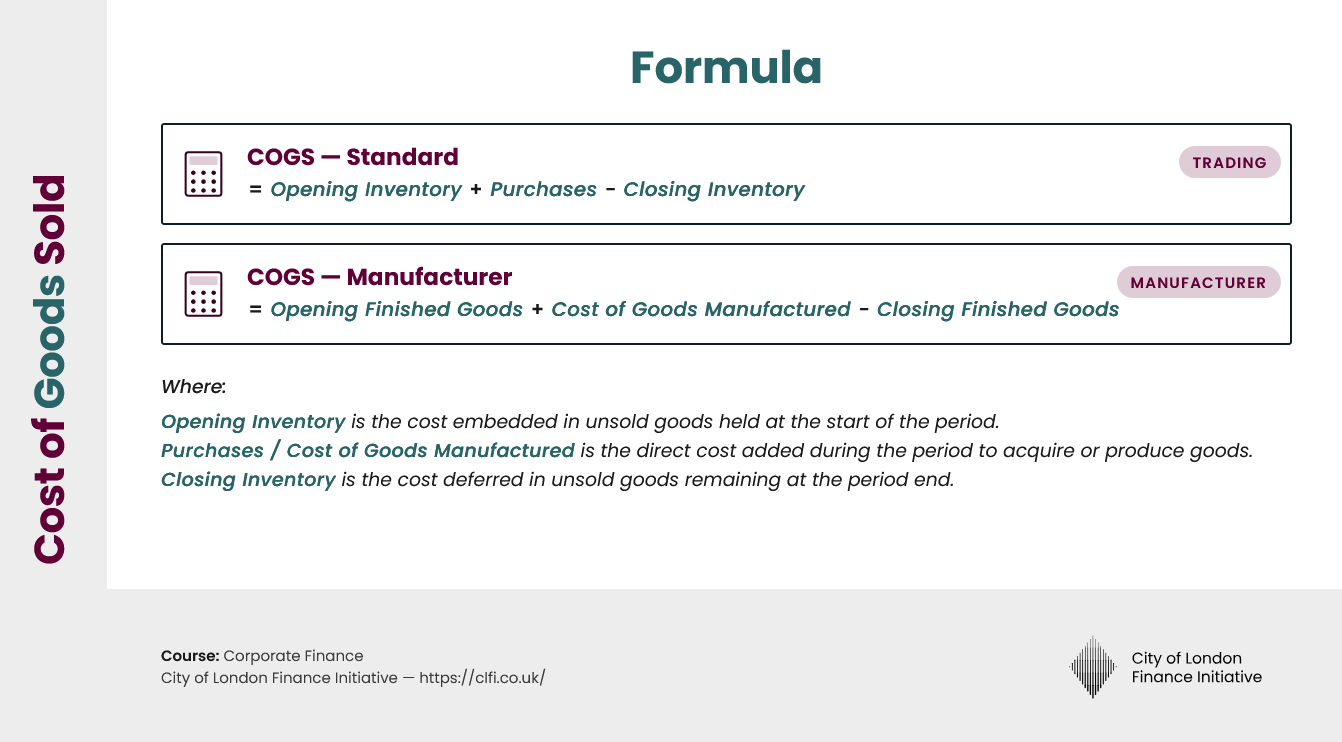
Table of Contents
What Is Cost of Goods Sold
Cost of Goods Sold, also called Cost of Sales, is the total direct cost attached to the units sold during an accounting period. Under IAS 2 Inventories, this usually includes raw materials consumed, direct labour applied in production, and production overhead that can be attributed to output on a reasonable basis.
Its importance comes from where it sits in the income statement and what it reveals. Once COGS is deducted from revenue, the result is gross profit, which shows whether the business can source or manufacture goods at a cost that still leaves room to cover operating expenses, service debt, and generate acceptable returns on capital.
How Cost of Goods Sold Works
COGS is governed by the matching principle, which means production or acquisition cost is recognised as an expense only when the related goods are sold. Until that point, those costs remain in inventory on the balance sheet, where they are carried forward as an asset rather than charged against current-period revenue.
This flow matters because it connects operational activity with reported profitability. A company begins the period with opening inventory, adds purchases or production cost during the period, and removes the value still held in closing inventory, so only the cost associated with units actually sold reaches the income statement.
As sales volume rises, COGS will often rise as well, though the pace of that increase depends on pricing discipline, efficiency, product mix, and inventory accounting. That is why gross margin is watched so closely by analysts, and why COGS is an essential bridge from revenue to EBITDA, operating cash flow, and ultimately discounted cash flow valuation.
COGS Formula
Inventory-based calculation and variable definitions
Standard Formula
COGS = Opening Inventory + Purchases or Production Cost - Closing Inventory
For manufacturers, COGS = Opening Finished Goods + Cost of Goods Manufactured - Closing Finished Goods
Definitions
Opening Inventory
Cost embedded in unsold goods held at the start of the period.
Purchases or Production Cost
Direct cost added during the period to acquire or make goods ready for sale.
Closing Inventory
Cost still carried in unsold goods at the end of the period.
The logic is straightforward because any cost left in closing inventory is deferred to a later period, while any cost attached to goods sold now becomes part of current-period COGS.
Cost of Goods Sold Formula
The formula matters because it turns inventory movement into an income statement expense. If closing inventory is overstated, COGS will be understated and gross profit will look stronger than it really is, while an understated closing inventory figure has the opposite effect and makes margins appear weaker.
Worked Example
A ceramics manufacturer enters the quarter with finished goods inventory valued at £120,000. During the quarter, it transfers newly produced goods into inventory at a cost of £480,000, and it closes the period with finished goods inventory valued at £90,000.
| Item | Amount |
|---|---|
| Opening finished goods inventory | £120,000 |
| Cost of goods manufactured | £480,000 |
| Closing finished goods inventory | £90,000 |
| COGS | £510,000 |
If revenue for the quarter is £850,000, gross profit is £340,000 and gross margin is 40 percent. That margin is useful because it isolates the economics of production before sales, marketing, administration, and financing are layered in, which helps management decide whether the problem lies in factory efficiency, input inflation, pricing, or overhead control elsewhere in the business.
Real-World Example
Unilever provides a practical illustration of how COGS shapes the economics of a large consumer goods business. In its 2023 results, the group reported turnover of roughly €59.6 billion and Cost of Sales of around €33 billion, which implies a gross margin of about 44.5 percent.
That margin does more than describe accounting performance because it funds marketing, distribution, research, and the wider operating model behind a global portfolio of brands. A two-point contraction in gross margin would materially affect operating cash generation, and that would flow through to forecasts of unlevered free cash flow and ultimately to estimates of enterprise value.
For analysts, the lesson is that reported COGS should never be read as a neutral line item. Classification choices, commodity inflation, product mix, and inventory accounting can all change the margin story, so the number only becomes meaningful once those drivers are understood in context.
Key Considerations and Limitations
COGS is only comparable across companies when the underlying accounting policies are comparable as well. Under IFRS, IAS 2 prohibits LIFO, while US GAAP still permits it, and that difference matters because a LIFO reporter facing rising input prices will usually show higher COGS and lower gross margin than an otherwise similar FIFO reporter.
Overhead policy matters just as much because the timing of expense recognition changes when more production overhead is capitalised into inventory. A company that carries a larger share of factory overhead on the balance sheet will delay part of the cost until sale, which can make current-period gross margin look stronger even though total expenditure across time is unchanged.
This becomes especially important in due diligence and valuation work. If gross margin looks weak because costs have been misclassified into COGS, or if it looks unusually strong because inventory accounting has deferred expense recognition, the analyst may misjudge the company’s true operating position and carry that error into pricing, integration planning, and cash flow forecasts.
Cost of Goods Sold vs Operating Expenses
The boundary between COGS and operating expenses is one of the most important classification lines in financial analysis because each category answers a different question. COGS tests the economics of producing or sourcing goods, while operating expenses show the cost of running the broader commercial and administrative platform.
| Comparison Point | Cost of Goods Sold | Operating Expenses |
|---|---|---|
| What it covers | Materials, direct labour, and attributable production overhead tied to goods sold | SG&A, marketing, R&D, and other non-production operating costs |
| Relationship to sales volume | Usually moves with units sold and product mix | Often more fixed over the short term |
| Income statement role | Deducted from revenue to produce gross profit | Deducted after gross profit to reach operating income |
| Inventory treatment | Held on the balance sheet until the goods are sold | Usually expensed in the period incurred |
| Analytical use | Tests production economics and gross margin quality | Tests organisational cost discipline and operating leverage |
Misclassifying operating expenses as COGS will depress gross margin without changing EBIT, which means the business can appear operationally weaker at the top of the income statement even when total operating profit is untouched. That distortion matters in peer benchmarking and in multiples work because the analyst may draw the wrong conclusion about cost structure before arriving at a valuation based on enterprise value and EBITDA.
In Practice
Cost of Goods Sold is more than a basic accounting line because it determines how the economics of production are translated into reported profitability. Read properly, it helps executives identify whether pressure is coming from input inflation, poor manufacturing efficiency, pricing weakness, inventory build, or accounting classification.
For decision-makers, the practical discipline is to move beyond the headline number. Compare gross margins only after confirming inventory methods, overhead policy, and cost classification, then connect the result to cash flow, valuation, and strategy. That is where COGS becomes useful, not as a static expense line, but as an operating signal that shapes pricing, procurement, investment, and performance review.
Understand the Cash Flow Behind Reported Profit
The Executive Certificate in Corporate Finance, Valuation & Governance examines working capital, cash flow analysis, and the link between accounting profit and operating performance.
Programme Content Overview
The Executive Certificate in Corporate Finance, Valuation & Governance delivers a full business-school-standard curriculum through flexible, self-paced modules. It covers five integrated courses — Corporate Finance, Business Valuation, Corporate Governance, Private Equity, and Mergers & Acquisitions — each contributing a defined share of the overall learning experience, combining academic depth with practical application.

Chart: Percentage weighting of each core course within the CLFI Executive Certificate curriculum.