
Table of Contents
Enterprise Value (EV): Formula, Definition and Examples
- 5 min read
- Authored & Reviewed by: CLFI Team
Enterprise Value (EV) represents the total value of a company to all its capital providers — both equity and debt. While shareholders often focus on market capitalisation and lenders on outstanding debt, EV brings these perspectives together into a single, comparable figure. It begins with the market value of equity, adds interest-bearing debt, lease liabilities where material, and minority interests where applicable, and subtracts cash and cash equivalents, since available cash effectively reduces the cost of acquisition. This overview outlines the rationale behind EV, presents its formula, and illustrates how it is applied in valuation analysis, trading multiples, and transaction contexts.
The use of Enterprise Value as a core measure for comparing businesses across capital structures is introduced within the Business Valuation Executive Course.
Table of Contents
- What Is Enterprise Value (EV)?
- The EV Formula and Why It Works
- Components: What to Include and What to Exclude
- Worked Example: Calculating EV Step by Step
- EV in Multiples: EV/EBITDA, EV/Revenue and Interpretation
- Common Pitfalls, Adjustments, and Edge Cases
- In Practice: Using EV in the Boardroom
- Explore Further from CLFI Insight
Definition:
Enterprise Value (EV)
A company’s total market value to all providers of capital, equal to the market value of equity plus net financial obligations and other claimholders, less cash and cash equivalents.
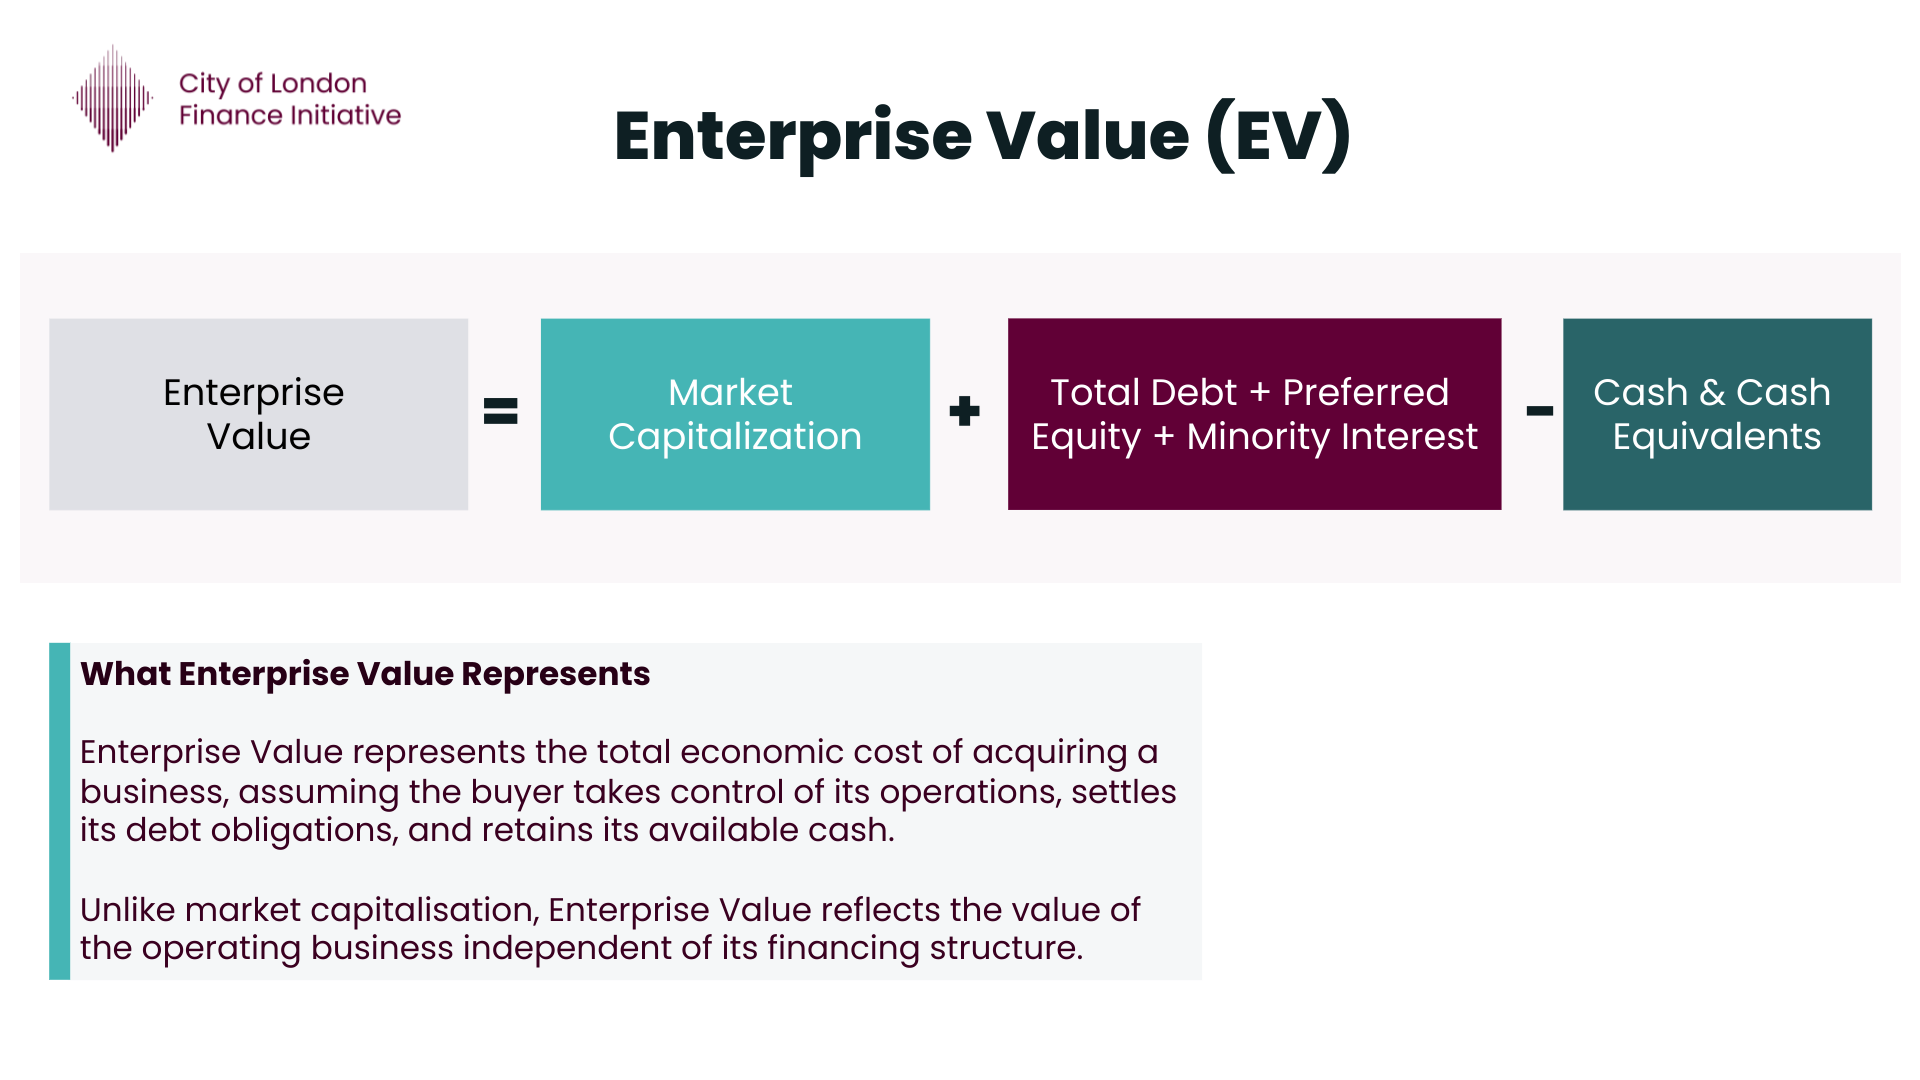
Enterprise Value (EV)
Enterprise Value captures the combined value of equity and debt holders, showing what it would cost to acquire the entire business. It starts with the market value of equity, adds all sources of financing that rank ahead of shareholders, and subtracts cash because any acquirer could use that cash to repay part of those obligations immediately.
What Is Enterprise Value (EV)?
Enterprise Value provides a comprehensive measure of what a business is worth to all investors — not just shareholders. It bridges the gap between accounting numbers and market valuation by capturing the full capital structure of the firm. Unlike book equity or total assets, EV reflects how markets currently price the company’s operations, financing, and risk profile.
In practical terms, EV allows analysts, investors, and corporate boards to compare firms on a like-for-like basis regardless of how they are financed. Two companies may generate identical operating profits, but if one relies heavily on debt while the other is mostly equity-funded, their market capitalisations will differ. Using EV eliminates that distortion. By valuing the firm before financing effects, it focuses the analysis on the efficiency of the underlying business — how well it converts invested capital into operating performance.
Components: What to Include and What to Exclude
Calculating EV starts with the company’s market capitalisation, based on the current share price multiplied by the fully diluted number of shares. To this, analysts add all interest-bearing debt — both short-term and long-term — as well as preferred equity and minority interests in subsidiaries, since these represent claims that stand ahead of ordinary shareholders.
From this total, cash and cash equivalents are subtracted, because that liquidity can effectively reduce the cost to acquire the firm. The goal is to reflect what a buyer would pay for the operating business, net of cash that can immediately be used to settle debt. Analysts may also include lease liabilities under IFRS 16 or ASC 842, or adjust for pension deficits when they behave like debt. Likewise, non-operating assets — such as excess marketable securities or investments unrelated to core operations — are often excluded to ensure that EV captures only the value of the continuing business.
Worked Example: Calculating EV Step by Step
Suppose a company’s share price is $250 with 3.2 billion diluted shares, giving a market cap of $800 billion. Debt totals $30 billion, lease liabilities $12 billion, minority interest $4 billion, and cash $25 billion. Adjusting for $5 billion of excess securities, EV equals $816 billion. This reconciles market and financing structures into a single measure of total firm value.
| Item | Amount (USD bn) |
|---|---|
| Market Capitalisation | 800 |
| Total Debt | 30 |
| Lease Liabilities | 12 |
| Preferred Equity | 0 |
| Minority Interest | 4 |
| Less: Cash & Equivalents | (25) |
| Less: Excess Marketable Securities | (5) |
| Enterprise Value (EV) | 816 |
EV in Multiples: EV/EBITDA, EV/Revenue and Interpretation
EV is used as the numerator in enterprise-level valuation ratios. EV/EBITDA gauges how much investors pay per unit of pre-interest operating cash flow, while EV/Revenue is useful for fast-growing or loss-making firms. Benefits include comparability across leverage levels, while risks arise when adjustments or scopes differ. Consistency across numerator and denominator is crucial.
Common Pitfalls, Adjustments, and Edge Cases
The main pitfalls are inconsistent scope, overstating cash, and ignoring hybrid instruments. In financial institutions EV is less meaningful because debt is an input rather than financing. A negative EV can appear in cash-rich firms but usually signals market doubt about future profitability or undisclosed obligations. Always check the economic substance of each component before comparing across peers.
In Practice: Using EV in the Boardroom
In practice, boards and executives use EV to evaluate capital structure, acquisitions, and shareholder returns. Comparing EV multiples to peers helps validate acquisition pricing. Linking EV movement to strategic actions clarifies how debt, buybacks, or investments affect overall corporate value. This makes EV a bridge between financial modelling and board-level strategy.
Programme Content Overview
The Executive Certificate in Corporate Finance, Valuation & Governance delivers a full business-school-standard curriculum through flexible, self-paced modules. It covers five integrated courses — Corporate Finance, Business Valuation, Corporate Governance, Private Equity, and Mergers & Acquisitions — each contributing a defined share of the overall learning experience, combining academic depth with practical application.

Chart: Percentage weighting of each core course within the CLFI Executive Certificate curriculum.
Price Is a Data Point. Value Is a Decision.
Learn more through the Executive Certificate in Corporate Finance, Valuation & Governance – a structured programme integrating governance, finance, valuation, and strategy.