
Table of Contents
UK M&A Valuations: 2025 EBITDA Multiples by Industry and Company Size
- 7 min read
- Authored & Reviewed by: CLFI Team
The UK mid-market M&A landscape has entered a period of stability — one defined not by exuberance, but by adaptation. After several years of geopolitical turbulence, inflation spikes, and tighter monetary conditions, the market appears to have internalised volatility as the new normal. For dealmakers across the United Kingdom and Ireland, 2025 has brought a cautious equilibrium: transaction volumes are steady, but valuations have softened modestly.
According to the Dealsuite M&A Monitor H1 2025, the average EBITDA multiple in the UK&I mid-market now stands at 5.3x, down slightly from 5.35x in late 2024. This minor correction reflects higher financing costs and a shift toward smaller transaction sizes — yet beneath the surface, the resilience of core industries remains evident. Sectors such as software, healthcare, and IT services continue to trade at substantial premiums, while others, including retail and construction, maintain more moderate valuations.
Table of Contents
- Overall Market Valuations
- EBITDA Multiples by Industry (UK&I 2025)
- Range and Spread by Sector
- Company Size and the Small Firm Premium
- Cross-Border Valuation Comparison
- How to Interpret and Use Multiples in Practice
- Recent Valuation References from UK and European Disclosures
- Explore Further from CLFI Insight
Overall Market Valuations
Despite a modest decline in the headline figure, the UK&I M&A mid-market continues to show strong resilience. Deal activity has stabilised following earlier contractions, with 37% of advisors reporting similar volumes to late 2024 and nearly half noting an increase in new mandates. The shift is not driven by a lack of confidence, but by a rebalancing of deal sizes. Transactions under £5 million have grown as a proportion of total activity, while those above £10 million have fallen by nine percentage points.
This shift toward smaller deals explains part of the slight dip in average multiples. In smaller enterprises, earnings tend to be less stable, and reliance on key personnel or customers introduces greater risk. Nevertheless, when viewed through a sector lens, the pattern is clear: structurally strong sectors have largely maintained their valuation premiums, demonstrating continued investor confidence.
EBITDA Multiples by Industry (UK&I 2025)
Definition:
EV/EBITDA Multiple
A valuation ratio comparing a company’s enterprise value (EV) to its earnings before interest, tax, depreciation, and amortisation (EBITDA). It indicates how much investors are willing to pay for each unit of operating profit, providing a cross-sector benchmark for acquisition pricing.
In the first half of 2025, the UK&I mid-market average EV/EBITDA multiple was 5.3x. While this figure suggests moderation, sector-level differences remain significant. Technology-led and knowledge-intensive industries continue to attract higher valuations, reflecting their scalability, recurring revenues, and growth prospects.
| Sector | Median EV/EBITDA (2025) | Change vs H2 2024 |
|---|---|---|
| Software Development | 8.2x | – |
| Healthcare & Pharmaceuticals | 7.6x | –0.3 |
| IT Services | 7.6x | –0.3 |
| E-commerce & Webshops | 6.4x | –0.2 |
| Business Services | 5.9x | +0.2 |
| Industrial & Manufacturing | 5.3x | +0.2 |
| Agri & Food | 5.3x | –0.2 |
| Media & Communication | 4.1x | –0.1 |
| Hospitality & Tourism | 4.1x | –0.1 |
| Automotive, Transport & Logistics | 4.0x | +0.1 |
| Construction & Engineering | 3.8x | +0.1 |
| Wholesale Trade | 3.5x | –0.3 |
| Retail Trade | 3.4x | –0.1 |
Software development remains the UK’s highest-valued sector, with median multiples above 8x, supported by stable demand for digital transformation and SaaS platforms. Healthcare follows closely at 7.6x, underpinned by demographic growth and defensive earnings. By contrast, retail and construction sectors continue to see valuations below 4x, constrained by cyclical pressures and margin volatility.
EV/EBITDA Multiples by Sector
Ranked by valuation multiple (highest to lowest)
UK and Ireland Market EV/EBITDA multiples by sector, highlighting high-value segments (Software, Healthcare, IT Services) vs. lower-value (Retail, Construction, Hospitality). Source: Dealsuite M&A Monitor H1 2025.
Price Is a Data Point. Value Is a Decision.
Learn more through the Executive Certificate in Corporate Finance, Valuation & Governance – a structured programme integrating governance, finance, valuation, and strategy.
Programme Content Overview
The Executive Certificate in Corporate Finance, Valuation & Governance delivers a full business-school-standard curriculum through flexible, self-paced modules. It covers five integrated courses — Corporate Finance, Business Valuation, Corporate Governance, Private Equity, and Mergers & Acquisitions — each contributing a defined share of the overall learning experience, combining academic depth with practical application.

Chart: Percentage weighting of each core course within the CLFI Executive Certificate curriculum.
Range and Spread by Sector
Even within a single industry, the spread of multiples can be substantial. Dealsuite’s analysis adjusts for outliers to show typical valuation ranges — software companies trade between 7.7x and 8.8x EBITDA, whereas retail and wholesale transactions cluster closer to 3–4x. This spread illustrates how business quality, growth trajectory, and recurring revenue shape investor appetite far more than sector label alone.
In sectors with asset-heavy models or cyclical revenues, valuation floors remain low. Conversely, companies with predictable income and low capital intensity attract higher multiples. These patterns persist across Europe and have become defining features of post-pandemic pricing discipline.
Company Size and the Small Firm Premium
Definition:
Small Firm Premium
An adjustment applied to valuation multiples recognising the higher risk and volatility of smaller businesses. Firms with limited customer diversification, key-person dependence, or uneven earnings typically command lower EBITDA multiples than larger peers with more stable cash flows.
Company size remains one of the most influential factors in valuation. In the UK mid-market, the difference between a business generating £200,000 EBITDA and one earning £10 million can amount to more than 5x in multiple terms. As of H1 2025, the average multiple for small firms (EBITDA c. £200k) was 3.1x, compared with 8.5x for firms around £10 million.
EV/EBITDA Multiples by EBITDA Size
Small-firm premium curve, benchmarked to average multiple of 5.7x.
EV/EBITDA multiples rising from 3.1x at £200k EBITDA to 8.5x at £10m EBITDA, illustrating the small-firm premium curve
This scaling effect is not purely mechanical — it reflects structural differences in risk. Smaller companies often have concentrated customer bases or limited access to professional management, making their earnings less predictable. Larger businesses benefit from operational leverage, financing access, and professionalised governance, all of which translate into higher perceived value.
Cross-Border Valuation Comparison
Compared with neighbouring European markets, UK&I valuations are competitive and broadly aligned with the continental average. DACH markets lead slightly with an average of 5.55x, while the UK&I sits at 5.3x — higher than France (4.9x) and Central & Eastern Europe (5.2x). For technology-oriented sectors such as software and healthcare, UK multiples remain among the highest in Europe, underscoring the region’s continued investor appeal despite economic headwinds.
Interpreting UK Valuations: Understanding Data Sources and Cross-Market Context
Capital deployment has become increasingly selective. With fewer publicly listed targets, delayed private equity exits, and record levels of uninvested corporate capital, the question of how much to pay for control — and who is prepared to pay it — now sits at the centre of dealmaking strategy. Across industries, M&A participants are operating in an environment shaped less by abundant liquidity, as seen after the 2008 financial crisis and the COVID stimulus period, and more by disciplined allocation and strategic intent.
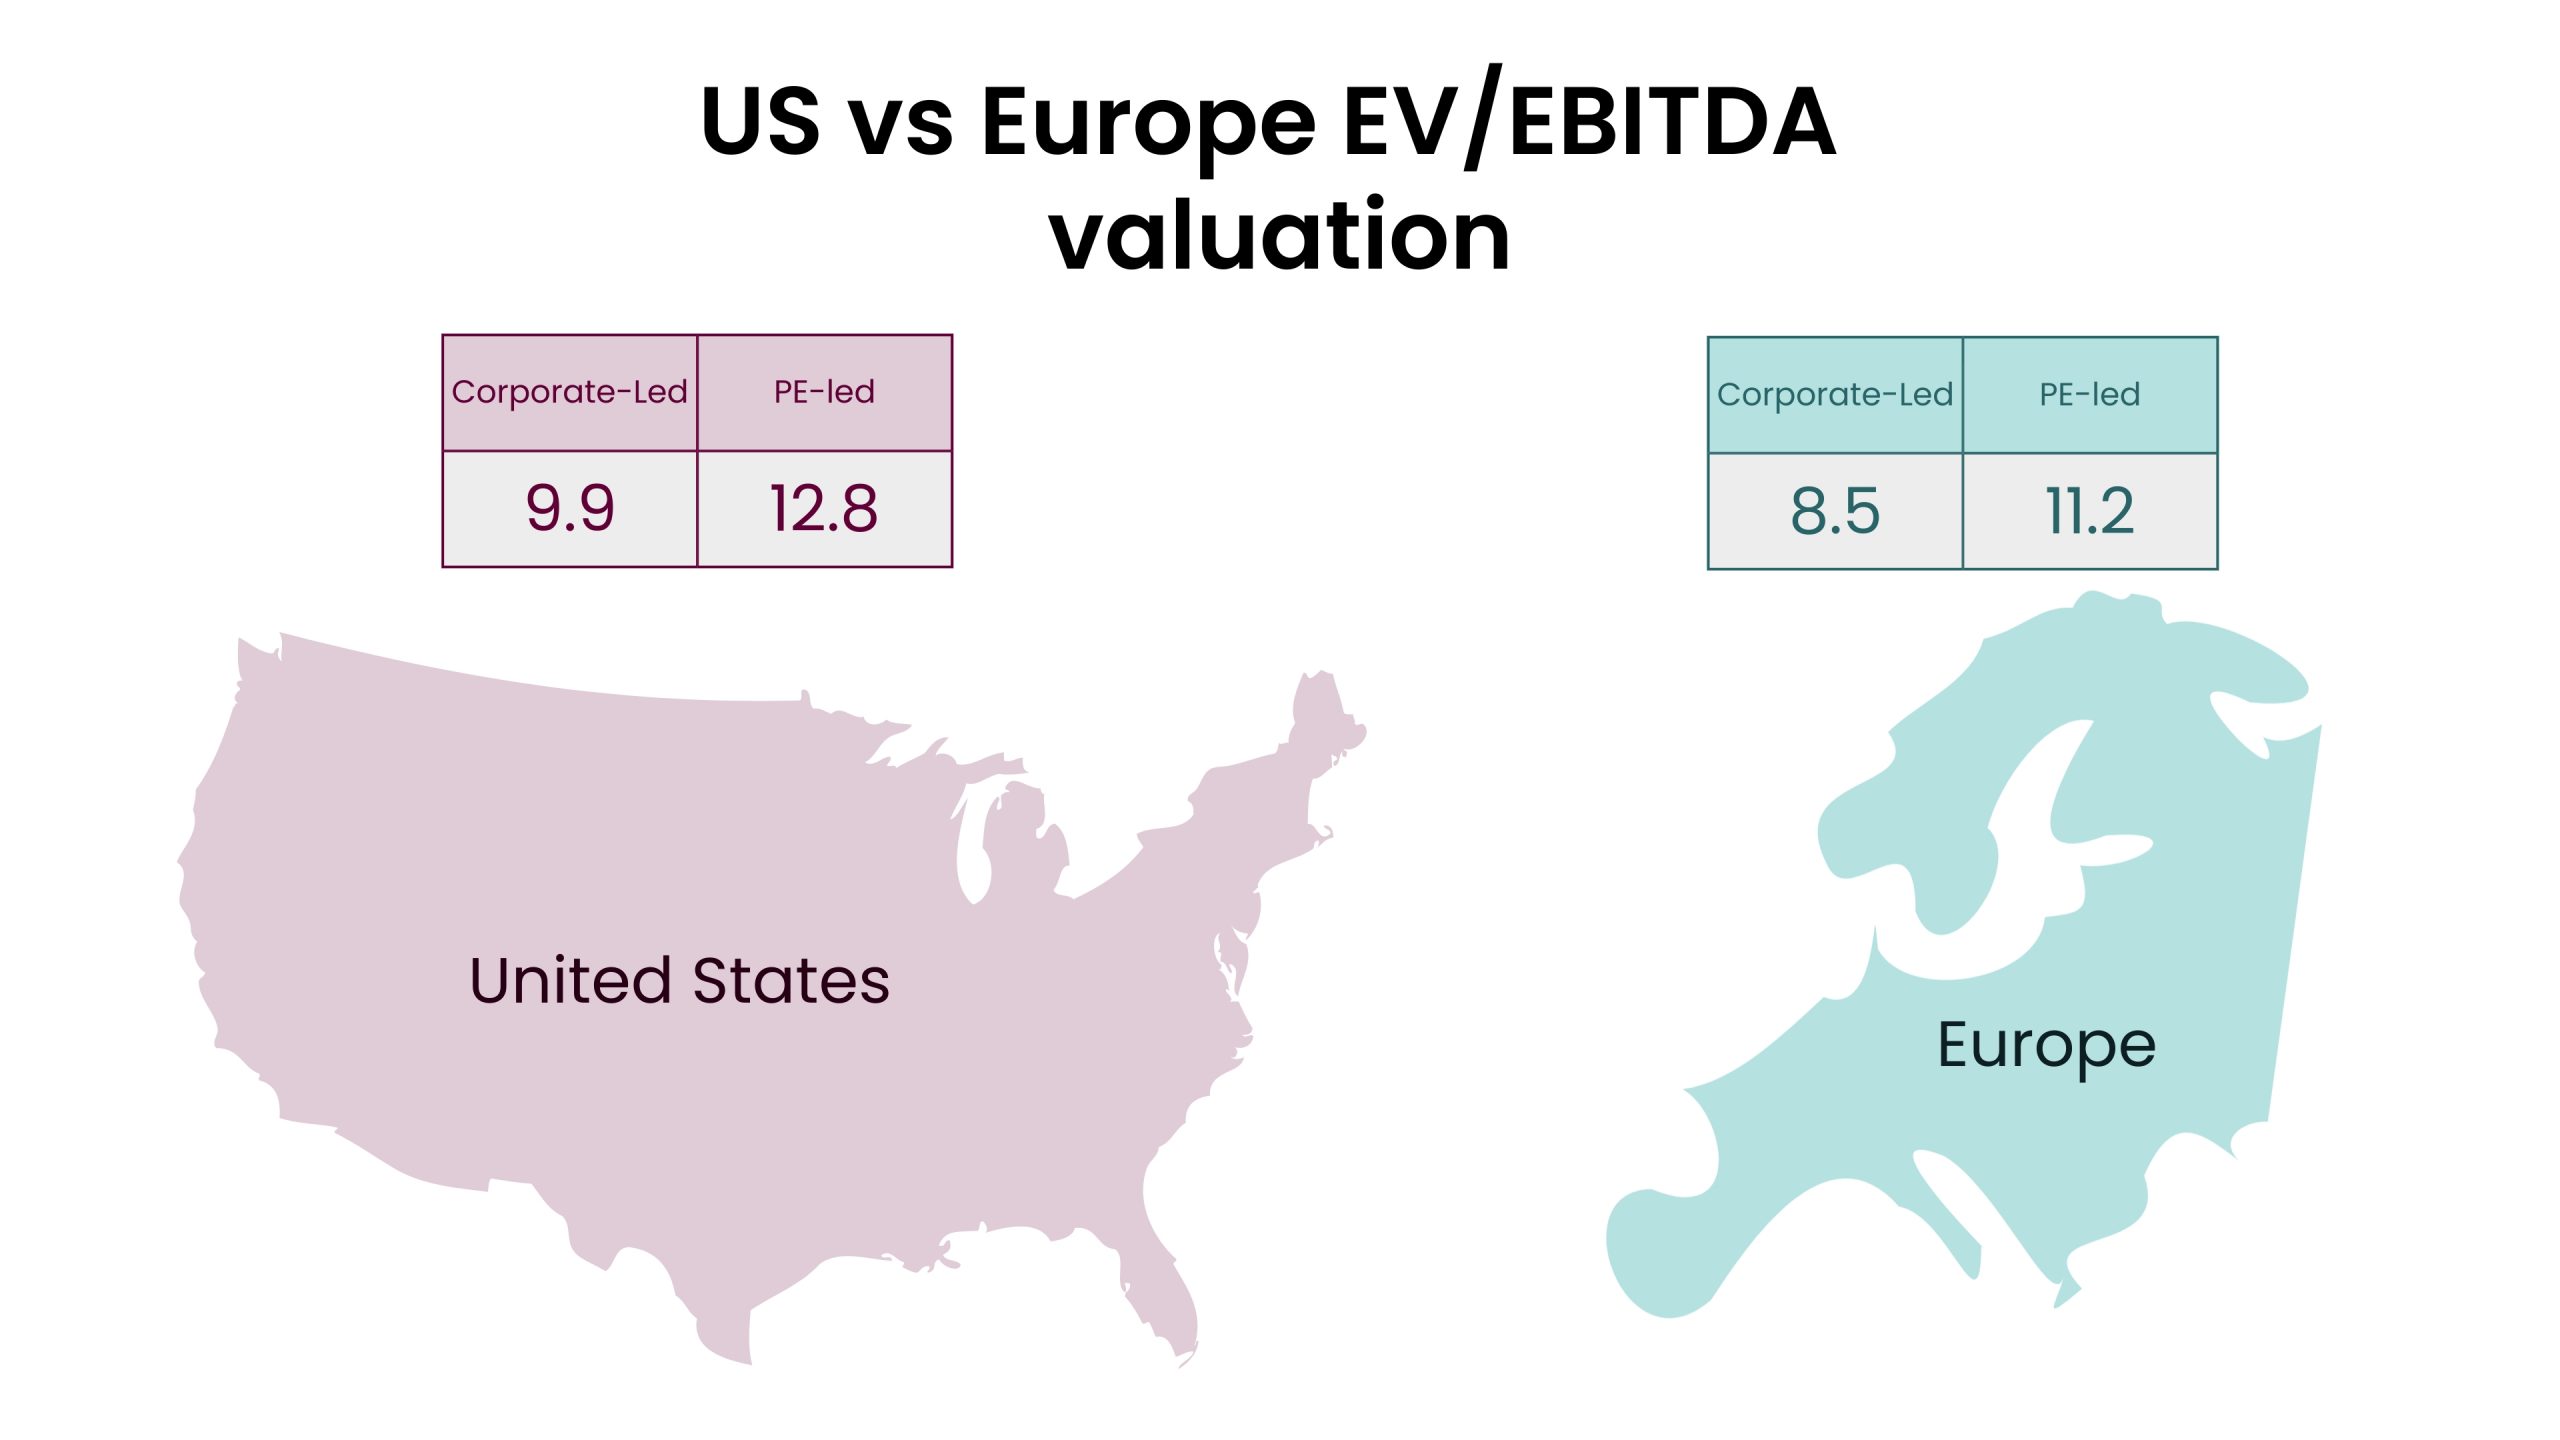
Readers comparing valuation multiples across markets often notice a visible difference between UK and US benchmarks. In the CLFI Insight on M&A EV/EBITDA Multiples by Buyer Type, US data showed private equity paying around 12.8× EBITDA for acquisitions, while corporates averaged 9.9×. In contrast, the UK&I mid-market multiple stands at 5.3×, based on Dealsuite’s 2025 survey of companies with £1–200 million in revenue.
However, these figures are not measuring the same market segment. The US averages reflect large, institutional transactions — often involving multibillion-dollar funds and high-leverage financing — whereas the UK data describes small and medium-sized enterprises where valuations are shaped by limited leverage, smaller deal sizes, and owner-managed structures. Comparing the two without adjustment risks misinterpreting the data entirely.
When adjusted for company scale and capital structure, UK transactions in the upper mid-market typically achieve 8–10× EBITDA, consistent with the US mid-market once leverage and size are considered. What looks like a valuation gap is largely a matter of composition — larger US transactions attract higher multiples due to scale, liquidity, and institutional capital depth, while UK mid-market pricing reflects a more conservative financing environment and a smaller transaction base.
How to Interpret and Use Multiples in Practice
For practitioners, business owners, and boards involved in valuation or M&A, the crucial step is understanding what data you are comparing — and how it has been derived. Different sources use different datasets: some rely on private surveys, others on public filings, and many exclude small, privately held businesses. Because there is no unified or central database for private-company multiples, expect to see variation in the figures published by Dealogic, PitchBook, or trade brokers. The key is not to chase one number, but to assess a range — including minimum, maximum, and either median or average (mean) values — to benchmark your transaction.
Anyone preparing a valuation should also understand the underlying profitability metric. To interpret or apply EBITDA multiples correctly, it is essential to know how EBITDA is calculated and adjusted. You can explore this in our explainer, What Is EBITDA?, and in our guide on Selling to Private Equity: Business Valuation Fundamentals, which covers the adjustments typically made by buyers during due diligence.
Recent Valuation References from UK and European Disclosures
Recent UK and European earnings reports also provide insight into how these valuation multiples apply in practice. The examples below, drawn from publicly available disclosures, illustrate the spread of EV/EBITDA multiples across different sectors and transaction types:
Foxtons Group plc (Capital Markets Day 2025)
Reported an average 2.9× EBITDA multiple paid for 11 acquisitions since 2020, post-synergies, within the UK estate agency sector.
Spire Healthcare Group plc (H1 2025 Results)
Disclosed bolt-on acquisitions in health and physiotherapy at around 5.5× EBITDA, consistent with mid-single-digit sector pricing.
Venture Life Group plc (H1 2025 Presentation)
Noted sector exit multiples for consumer healthcare businesses averaging 14–15× EBITDA historically.
Oakley Capital Investments (Half-Year Report 2025)
Reported an average 16.3× EV/EBITDA multiple for its European private equity portfolio, reflecting steady upper-market valuations.
HgCapital Trust plc (Q2 2025 Report)
Valued its technology portfolio at an average 25.7× EV/EBITDA, consistent with software-sector comparables under IPEV standards.
Private Equity Market (Neuberger Berman, Q2 2025)
Reported European buyout medians of 11–12× EV/EBITDA, versus approximately 10× in the US, based on PitchBook data.
3i Group plc (FY 2025 Reporting)
Valued its Action retail investment using a 14.7×–18.5× EBITDA range, representing upper-tier private equity benchmarks.
These references show that UK and European M&A and private equity transactions in 2025 typically fall between 5× and 12× EBITDA, depending on sector, size, and growth profile. Sectors such as consumer healthcare and technology consistently command higher multiples, while property and service-based M&A sit closer to the 3–6× range.
Together, these examples demonstrate that valuation multiples are best read as ranges rather than absolutes. Differences between datasets often arise from the sample’s size, data source, and inclusion criteria. For executives interpreting multiples — whether benchmarking a business or negotiating a sale — context is everything. The value of a multiple lies not in its precision, but in the analytical discipline applied when using it.
This analytical discipline, particularly the use of relative valuation methods such as EV/EBITDA and precedent transactions, is developed in the Business Valuation Executive Course.
Explore Further from CLFI Insight
References:
- Dealsuite (2025). M&A Monitor UK&I H1 2025. Amsterdam: Dealsuite Research.
- PitchBook Data, Inc. (2025). Global M&A Valuation Benchmarks.
- Insights with City of London Finance Initiative
- Research insights from UK and European earning reports were supported by our research partner, Quartr, through the Quartr Pro platform.
Important Disclaimer
The valuation multiples, EBITDA ranges, and transaction benchmarks presented in this article are provided for educational and analytical purposes only. They do not constitute investment advice, fairness opinions, valuation services, or recommendations to buy, sell, or transact in any security or business.
Actual valuation outcomes depend on company-specific fundamentals, capital structure, growth profile, market conditions, deal dynamics, and negotiation factors. Readers should seek independent professional advice before making financial, investment, or transaction decisions.