The Cash Conversion Cycle, or CCC, is a practical measure of how efficiently a company manages its working capital. It tracks the number of days it takes for cash invested in inventory and operations to return as cash collected from customers. In simple terms, it answers a key business question: how long does it take for every pound or euro spent to come back as cash in hand? This article explains the CCC formula, breaks down its components, and shows how businesses and investors use it to assess financial health.
Table of Contents
- What Is the Cash Conversion Cycle?
- Why the CCC Matters
- The CCC Formula
- Days Sales Outstanding (DSO)
- Days Sales in Inventory (DSI)
- Days Payables Outstanding (DPO)
- Worked Example: Calculating the CCC
- Limits of the CCC
- Further Reading
What Is the Cash Conversion Cycle?
https://clfi.co.uk/
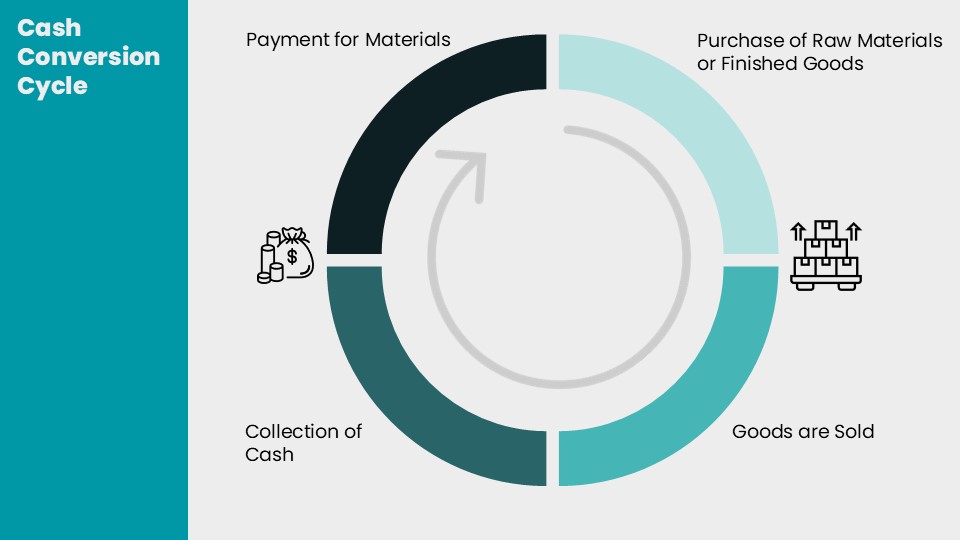
The Cash Conversion Cycle measures the time it takes for a business to turn outflows—such as payments for raw materials or finished goods—into inflows from customer payments. A shorter cycle means cash returns quickly, freeing up liquidity. A longer cycle signals that money is tied up in stock or receivables for extended periods, which can strain a company’s ability to fund operations. Because it combines inventory, receivables, and payables, the CCC is widely used as an indicator of operational efficiency.
Why the CCC Matters
For managers, the CCC highlights how effectively working capital is being managed. Investors and lenders pay attention because a shorter cycle usually means less reliance on external financing. A company with a negative CCC—common in large retailers—collects cash from customers before paying suppliers, which can be a strong advantage. Conversely, a business with a very long CCC may look profitable on paper but still face liquidity pressures because cash is slow to arrive.
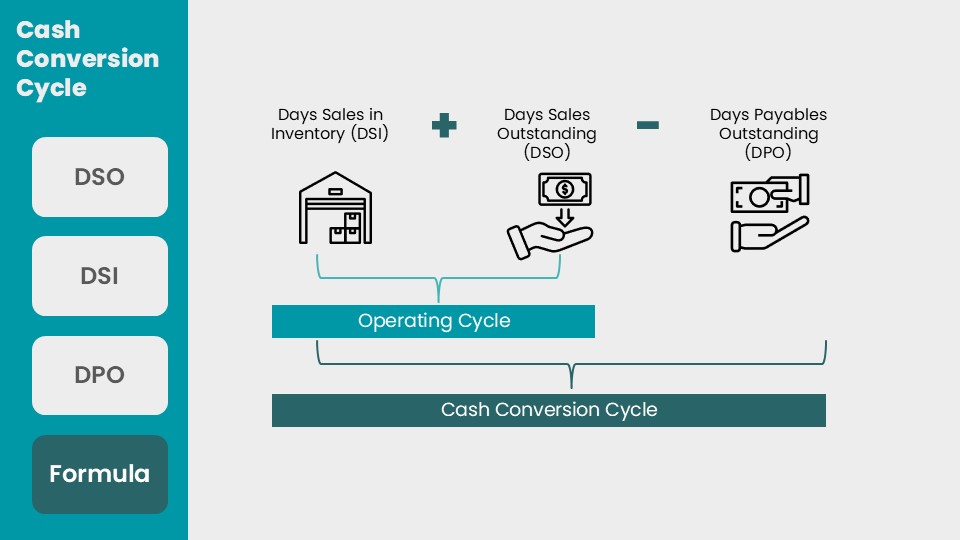
The CCC Formula
The standard formula for the Cash Conversion Cycle is:
CCC = DSI + DSO − DPO
Where:
- DSI = Days Sales in Inventory (how long it takes to sell stock)
- DSO = Days Sales Outstanding (how long it takes to collect from customers)
- DPO = Days Payables Outstanding (how long the company takes to pay suppliers)
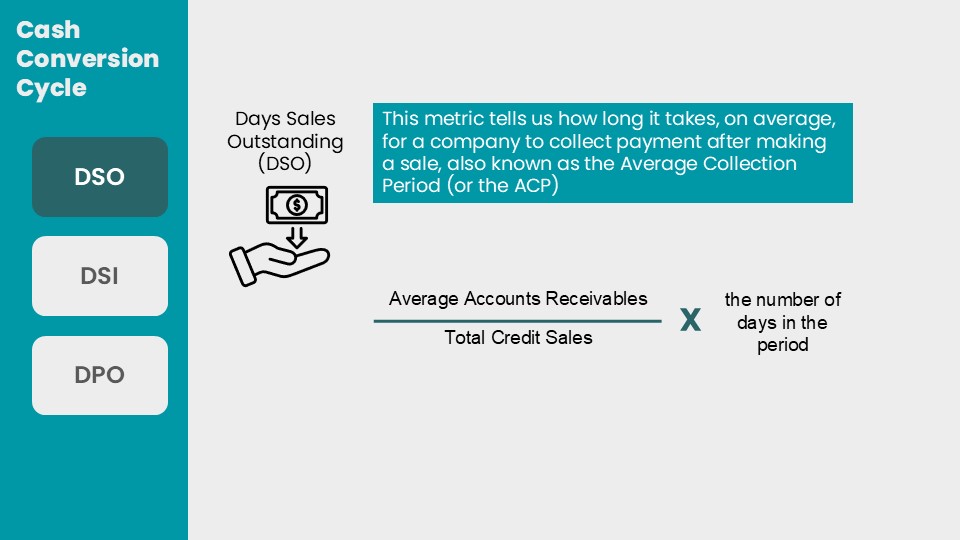
Days Sales Outstanding (DSO)
DSO measures the average number of days it takes a company to collect payment after a sale. To calculate this, we use the following formula:
Module 02: Operational & Strategic Financial Management
A lower DSO means customers are paying quickly; a higher DSO suggests cash is slow to arrive. For example, if a company has average receivables of €200,000 and annual credit sales of €1,200,000, the DSO is about 61 days. This means on average it takes two months to collect payment.
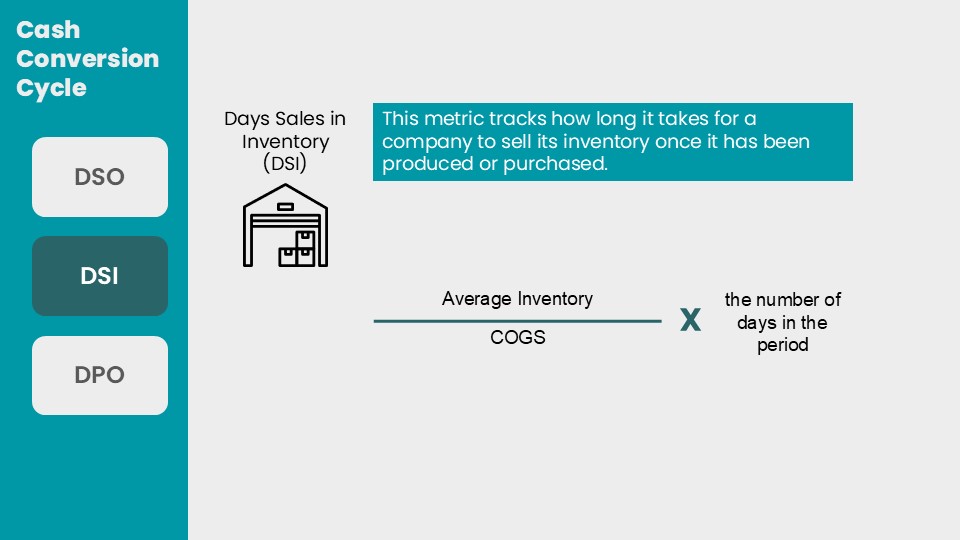
Days Sales in Inventory (DSI)
DSI tracks how long goods remain in stock before being sold. A lower DSI means faster inventory turnover. To calculate this, we use the following formula:
Module 02: Operational & Strategic Financial Management
A higher DSI may suggest inefficiency, overstocking, or weak demand. For example, if average inventory is €150,000 and cost of goods sold is €900,000, the DSI is about 61 days. On average, it takes two months to sell what is on hand.
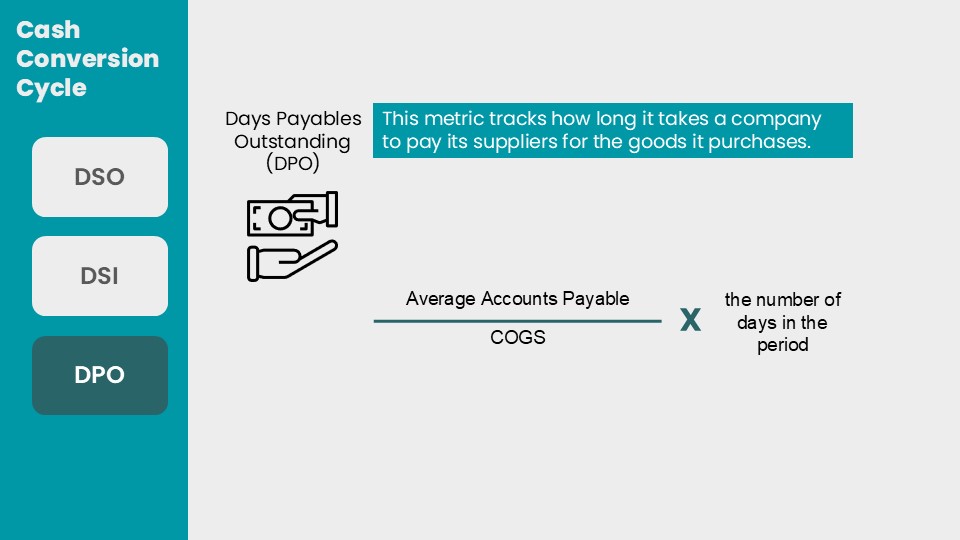
Days Payables Outstanding (DPO)
DPO measures the average time a company takes to pay its suppliers. To calculate this, we use the following formula:
Module 02: Operational & Strategic Financial Management
A higher DPO means the company is holding on to cash longer, which can support liquidity. However, stretching payments too far can strain supplier relationships. For example, if average accounts payable are €100,000 and annual cost of goods sold is €900,000, DPO is about 41 days.
Worked Example: Calculating the CCC
Suppose a company reports the following (in €):
- DSO = 61 days
- DSI = 61 days
- DPO = 41 days
The formula is:
Module 02: Operational & Strategic Financial Management
CCC = 61 + 61 − 41 = 81 days
This means, on average, it takes the business 81 days from paying suppliers to collecting cash from customers. A company with a shorter cycle—say 40 days—would recover its cash more quickly, reducing financing needs.
Limits of the CCC
Like all metrics, the CCC has limitations. It is most useful when comparing a company with its past performance or with peers in the same industry. Different business models can produce very different CCCs, making cross-sector comparisons less meaningful. For example, supermarkets often have negative CCCs because customers pay in cash immediately while suppliers grant long credit terms. In contrast, heavy manufacturing firms may face long CCCs due to extended production and receivables cycles. The CCC should therefore be interpreted in context, alongside broader measures of liquidity and profitability.
Programme Content Overview
The Executive Certificate in Corporate Finance, Valuation & Governance delivers a full business-school-standard curriculum through flexible, self-paced modules. It covers five integrated courses — Corporate Finance, Business Valuation, Corporate Governance, Private Equity, and Mergers & Acquisitions — each contributing a defined share of the overall learning experience, combining academic depth with practical application.

Chart: Percentage weighting of each core course within the CLFI Executive Certificate curriculum.