

A cost pool groups related overhead costs so they can be allocated to products, services, departments, or other cost objects using a cost driver that reflects resource consumption. It gives management a practical way to convert indirect expenditure into usable cost information, which improves margin analysis, pricing decisions, and operational planning when direct tracing is not possible.
Definition
Cost Pool
A cost pool is a grouping of related indirect costs that are accumulated together and then allocated using a cost driver to the products, services, or departments that consume the underlying resources.
What it is
A cost pool gathers indirect costs with a shared economic cause before those costs are allocated to cost objects.
How allocation works
The total cost in the pool is divided by total driver units to produce a rate, and each cost object absorbs overhead in proportion to its actual driver usage.
Why it matters
Accurate pooling improves product costing, which feeds directly into pricing, margin analysis, budgeting, and investment decisions.
Where it is used
Management accounting, activity-based costing, profitability analysis, and overhead absorption systems all rely on cost pools.
Key limitation
The result is only as reliable as the driver selected, because overhead rarely moves in perfect proportion to a single operational measure.
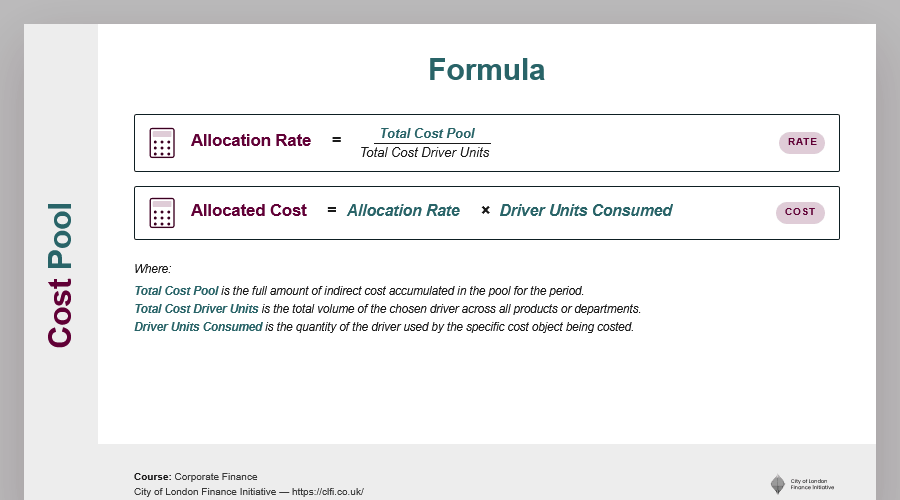
Table of Contents
What Is a Cost Pool
A cost pool is a management accounting grouping that collects indirect costs sharing a common origin, activity, or operating relationship before they are allocated to cost objects. Instead of tracing each overhead item separately, the business accumulates similar costs into one pool and applies them systematically through an overhead absorption method, which makes costing more practical when production or service delivery depends on shared resources.
Cost pools sit at the centre of both traditional absorption costing and more refined activity-based costing models. Their usefulness depends on the match between the pool and the driver assigned to it, because that match determines whether reported product costs reflect the way resources are actually consumed. This is why cost pool design matters not only for accounting accuracy but also for decisions on pricing, efficiency, and portfolio focus within corporate finance.
How a Cost Pool Works
A cost pool works by linking overhead grouping to overhead allocation. The business first gathers indirect costs that respond to a similar underlying cause, so machine maintenance, spare parts, and diagnostic services may sit in one pool while rent, utilities, and insurance may sit in another. Grouping costs this way improves the connection between cost and activity, which becomes essential once management wants unit costs that are decision-ready rather than merely compliant.
Once the pool has been created, the business selects a cost driver that reflects consumption of the pooled resource. Machine hours often suit maintenance costs because products that use equipment more intensively create more wear, while pallet movements may suit logistics costs because storage and handling increase with physical throughput. Dividing the pool total by total driver units produces an allocation rate, and that rate is then applied to each cost object according to actual usage. The benefit is not abstract, because a stronger link between cause and allocation usually produces more reliable margins and more credible operating forecasts, which then influence measures such as EBITDA.
Allocation Rate Formula
How a cost pool becomes a product or service level charge
Formula
Allocation Rate = Total Cost Pool ÷ Total Cost Driver Units
Allocated Cost = Allocation Rate × Driver Units Consumed by the Cost Object
Definitions
Total Cost Pool
The full amount of indirect cost accumulated in the pool for the period.
Total Cost Driver Units
The total volume of the chosen driver across all products, services, or departments.
Allocation Rate
The overhead charge per driver unit.
Driver Units Consumed
The quantity of the driver used by the specific cost object being costed.
The logic matters because allocation rates turn a large undifferentiated overhead figure into charges that can be compared across products. If the driver reflects real consumption, the resulting unit costs become more informative for pricing and capacity decisions. If it does not, the numbers may still look precise while pointing management in the wrong direction.
Consider a manufacturing business with a machine maintenance cost pool of £240,000 for the year. Product A uses 6,000 machine hours, Product B uses 8,000 hours, and Product C uses 6,000 hours, so total driver usage is 20,000 machine hours. The allocation rate is therefore £12 per machine hour, and the allocated maintenance cost becomes £72,000 for Product A, £96,000 for Product B, and £72,000 for Product C. Product B absorbs the largest share because it consumes the most machine time, which is exactly the relationship the pool was designed to represent.
Real-World Example
A food manufacturer producing three product ranges across shared equipment and refrigerated warehousing had long used one overhead absorption rate based on direct labour hours. That method produced acceptable results for labour-intensive lines, though it understated the cost of ranges that consumed large amounts of machine time and cold storage capacity. Once management split overhead into two pools, one for machine operations and one for logistics, the economics of the portfolio changed materially because the revised model showed that a previously attractive range carried a much heavier overhead burden than reported before.
The table below shows how the difference emerges when the business moves from a single blanket rate to separate pools matched with more appropriate drivers.
| Product Range | Reported Margin Under Blanket Rate | Margin After Pool-Based Allocation | Primary Reason |
|---|---|---|---|
| Range A | 18.5% | 14.2% | High machine usage and above-average refrigerated storage |
| Range B | 15.1% | 16.3% | Moderate driver usage under both pools |
| Range C | 12.7% | 15.4% | Less machine intensity than labour hours had implied |
What matters here is not simply that margins moved, but that management gained a more defensible view of where value was actually being created. That change can alter pricing, capital allocation, and even product continuation decisions, especially when one range appears attractive only because overhead has been spread too broadly.
Key Considerations and Limitations
Cost pools improve overhead allocation, though they do not eliminate judgement. The largest source of distortion is driver selection because a machine-hour driver may explain maintenance costs well while failing to capture activities driven by setup frequency, order complexity, or batch size. When a pool is defined too broadly, the apparent precision of the resulting cost rate can hide a weak causal link between cost and consumption.
The design burden also rises as the model becomes more granular. Activity-based costing systems with many narrowly defined pools can produce more accurate product costs, but they require stronger data collection, regular review, and greater maintenance effort. In businesses with a stable product mix, the extra precision may justify the cost. In simpler environments, a lighter approach may achieve much the same decision value with less operational friction.
These choices have consequences beyond management reporting. If pool-based cost data feeds into forecasts, valuations, or performance analysis, the allocation methodology should reflect current operating behaviour rather than inherited convention. That is especially important when cost assumptions support projections of unlevered free cash flow, because distorted operating costs can carry through into enterprise value estimates.
Cost Pool vs Cost Centre
A cost centre and a cost pool may appear similar because both collect costs, yet they serve different purposes. A cost centre is an organisational unit used for responsibility accounting and cost control, so it normally sits inside the management structure and has someone accountable for its expenditure. A cost pool is an analytical grouping created for allocation, which means it may combine costs drawn from several cost centres if that creates a better match between overhead and the activity driving it.
| Feature | Cost Pool | Cost Centre |
|---|---|---|
| Nature | Analytical grouping for allocation | Organisational unit for monitoring and control |
| Permanence | Created for costing design | Standing part of the reporting structure |
| Accountability | No manager is assigned to the pool itself | A manager is responsible for costs incurred |
| Purpose | Distribute indirect costs to cost objects | Track and manage costs by department or function |
The distinction matters in practice because cost centre data measures controllable expenditure at a responsibility level, whereas product-level costs often include overhead drawn from several pools across several centres. Treating one as a substitute for the other can distort profitability analysis and weaken management accountability at the same time.
In Practice
A cost pool is most useful when management needs a fairer way to translate shared operating costs into product or service level economics. It improves on blanket overhead rates because it forces a clearer connection between cost behaviour and resource usage, which usually leads to better pricing and portfolio decisions. Yet the quality of the answer depends on the design of the model, especially the choice of driver and the degree of pool granularity.
For executives, the real decision is not whether to allocate overhead, because that is unavoidable, but how much analytical effort is justified by the improvement in decision quality. Well-designed cost pools sharpen product profitability analysis and strengthen forecast credibility. Poorly designed pools simply produce neater distortions. That is why cost pool design belongs in the wider discipline of financial judgement rather than in accounting mechanics alone.
References
- Drury, C. Management and Cost Accounting. Cengage Learning, 9th edition, Chapters 3 and 4.
- CIMA. Management Accounting Decision Management. Chartered Institute of Management Accountants.
Programme Content Overview
The Executive Certificate in Corporate Finance, Valuation & Governance delivers a full business-school-standard curriculum through flexible, self-paced modules. It covers five integrated courses — Corporate Finance, Business Valuation, Corporate Governance, Private Equity, and Mergers & Acquisitions — each contributing a defined share of the overall learning experience, combining academic depth with practical application.

Chart: Percentage weighting of each core course within the CLFI Executive Certificate curriculum.